
Page 292 - The Atlas of Economic Complexity
P. 292
MAPPING PATHS TO PROSPERITY | 293
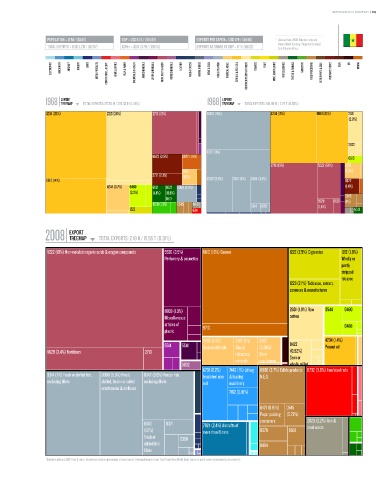
POPULATION ≥ 12 M / (63/18) GDP ≥ USD 13 b / (106/15) EXPORTS PER CAPITA ≥ USD 179 / (114/16) * Data are from 2008. Numbers indicate:
value (World Ranking / Regional Ranking).
TOTAL EXPORTS ≥ USD 2.2 b / (112/17) GDPpc ≥ USD 1,079 / (107/15) EXPORTS AS SHARE OF GDP ≥ 17 % (111/22) Sub-Saharan Africa.
ELECTRONICS MACHINERY AIRCRAFT bOILERS SHIPS METAL PRODUCTS CONSTR. MATL. & EqPT. HOME & OFFICE PULP & PAPER CHEMICALS & HEALTH AGROCHEMICALS OTHER CHEMICALS INOR. SALTS & ACIDS PETROCHEMICALS LEATHER MILK & CHEESE ANIMAL FIbERS MEAT & EGGS FISH & SEAFOOD TROPICAL AGRIC. CEREALS & vEG. OILS COTTON/RICE/SOY & OTHERS TObACCO FRUIT MISC. AGRICULTURE NOT CLASSIFIED TEXTILE & FAbRICS GARMENTS FOOD PROCESSING bEER/SPIRITS & CIGS. PRECIOUS STONES COAL OIL MINING
EXPORT EXPORT
1968 TREEMAP TOTAL EXPORTS: 177.55 M / 228.33 b (0.08%) 1988 TREEMAP TOTAL EXPORTS: 551.69 M / 2.79 T (0.02%)
Total Exports: 177.55 M / 228.33 B (0.08%) Total Exports: 551.69 M / 2.79 T (0.02%)
4234 (26%) 2221 (20%) 2713 (12%) 0360 (15%) 4234 (15%) 0813 (10%) 2631
(2.8%)
2922
0371 (11%)
6672 (3.5%) 2877 (1.8%) 0615
2713 (15%) 5222 (5.1%) 2782
2783 (1.5%)
2771 (2.3%) (1.5%)
0813 (14%) 0342 (5.8%) 0341 (4%) 0344 (3.4%) 6672
4244 (3.7%) 0460 6521 6522 0360 (2.2%) (1.4%)
(2.3%) (1.4%) (0.8%)
6513 5629 5622 0545
8510 (1.3%) 0545 9410 0814 0350 (1%)
1222 6341 (1.4%) 6513
EXPORT
2008 TREEMAP TOTAL EXPORTS: 2.19 b / 15.56 T (0.01%)
Total Exports: 2.19 B / 15.56 T (0.01%)
5222 (18%) Non-metals inorganic acids & oxygen compounds 5530 (3.5%) 6612 (10%) Cement 1222 (2.5%) Cigarretes 1212 (1.8%)
Perfumery & cosmetics Wholly or
partly
stripped
tobacco
1223 (2.1%) Tobbacco, extract,
essences & manufactures
8939 (1.3%) 2631 (1.9%) Raw 0544 0460
Miscellaneous cotton
articles of 9710 0488
plastic
2783 (1.4%) 2782 (1%) 2882 4234 (1.4%)
5514 5541 Sodium chloride Clay & (0.94%) 0422 Peanut oil
5629 (3.4%) Fertilizers 2713 refractory Other (0.92%)
minerals, non-ferrous Semi or
5832 N.E.S. base metals wholly milled
6731 (2.2%) 7442 (1%) Lifting 0980 (2.7%) Edible products 6732 (3.6%) Iron/steel rods
rice
0341 (7%) Fresh or chilled fish, 0360 (5.5%) Fresh, 0342 (3.8%) Frozen fish, Iron/steel wire & loading N.E.S.
excluding fillets chilled, frozen or salted excluding fillets rod machinery
crustaceans & molluscs
7162 (0.81%)
6421 (0.91%) 0545
Paper packing (0.72%)
containers 2820 (2.2%) Iron &
0343 0371 7924 (2.4%) Aircrafts of
(1.2%) more than 15 tons 0579 8931 steel waste
Fresh or 0350
chilled fish 0484
fillets
* Numbers indicate SITC-4 rev 2 codes. Parenthesis indicate percentage of total exports. Treemap Headers show: Total Trade/Total World Trade (share of world trade represented by the country).