
Page 296 - The Atlas of Economic Complexity
P. 296
MAPPING PATHS TO PROSPERITY | 297
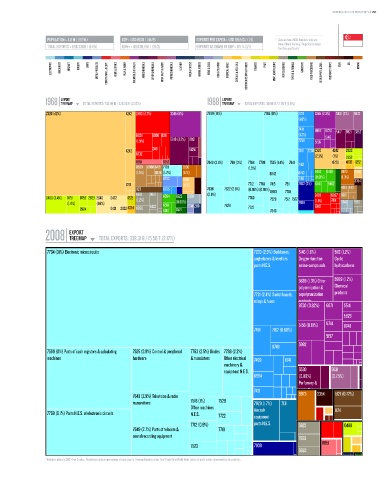
POPULATION ≥ 4.8 M / (97/14) GDP ≥ USD 193 b / (44/9) EXPORTS PER CAPITA ≥ USD 69,843 / (1/1) * Data are from 2008. Numbers indicate:
value (World Ranking / Regional Ranking).
TOTAL EXPORTS ≥ USD 338 b / (14/5) GDPpc ≥ USD 39,950 / (19/2) EXPORTS AS SHARE OF GDP ≥ 175 % (1/1) East Asia and Pacific.
ELECTRONICS MACHINERY AIRCRAFT bOILERS SHIPS METAL PRODUCTS CONSTR. MATL. & EqPT. HOME & OFFICE PULP & PAPER CHEMICALS & HEALTH AGROCHEMICALS OTHER CHEMICALS INOR. SALTS & ACIDS PETROCHEMICALS LEATHER MILK & CHEESE ANIMAL FIbERS MEAT & EGGS FISH & SEAFOOD TROPICAL AGRIC. CEREALS & vEG. OILS COTTON/RICE/SOY & OTHERS TObACCO FRUIT MISC. AGRICULTURE NOT CLASSIFIED TEXTILE & FAbRICS GARMENTS FOOD PROCESSING bEER/SPIRITS & CIGS. PRECIOUS STONES COAL OIL MINING
EXPORT EXPORT
1968 TREEMAP TOTAL EXPORTS: 733.95 M / 228.33 b (0.32%) 1988 TREEMAP TOTAL EXPORTS: 30.98 b / 2.79 T (1.11%)
Total Exports: 733.95 M / 228.33 B (0.32%) Total Exports: 30.98 B / 2.79 T (1.11%)
2320 (42%) 4242 2483 (4.7%) 3345 (5%) 7599 (18%) 7764 (11%) 7721 3345 (2.3%) 5831 (2%) 5832
(1.6%)
7431 5982 8720 5417 8921 3352
6924 6996 6341 (1.2%) 5146
(1.9%) 0819 (3.3%) 8921 7758 5156
2481
4243 6424 7491 7239 2320 4242 2923
6732
(2.3%) (1%) 0752
8851 6652 7649 (3.8%) 7611 (3%) 7768 7788 7525 (1.4%) 7641 7162 0723 4232 1222
0589 0980 6421 7781 2890 (1.5%)
(1.5%) 0586 (1.2%) (1.1%) 8942 8743 8463 8459 8973 2882
6783 2876 7169 (0.91%) (1.3%) 3354
2231 (1.1%) 7712 7761 7415 7511 7932 (2%) 8441 8462
1123 6785 7638 7622 (2.5%) (0.95%)(0.95%) 8983 7781 4313 1110
6651 9610 (2.9%) 2483 6997 8931
0460 (2.4%) 0751 0752 2923 2640 0422 1222 (1.2%) 6584 6522 0350 7763 7528 7512 7522 7414
(1.4%) (1.6%) 6423 6581 (0.96%) 0014 2119 7628 7938 (1.1%) 0342 2820
6342
2924 0421 2922 4234 8999 8310 6521 7722 7643
EXPORT
2008 TREEMAP TOTAL EXPORTS: 338.31 b / 15.56 T (2.17%)
Total Exports: 338.31 B / 15.56 T (2.17%)
7764 (31%) Electronic microcircuits 7239 (2.9%) Bulldozers, 5146 (1.6%) 5112 (1.2%)
angledozers & levellers Oxygen-function Cyclic
parts N.E.S. amino-compounds hydrocarbons
5839 (1.3%) Other 5989 (1.2%)
polymerization & Chemical
7721 (2.4%) Switchboards, copolymarization products
relays & fuses products
8720 (0.82%) 6871 5514
5829
5156 (0.81%) 8744 8748
7491 7162 (0.68%)
5157
8749 5982
7599 (8%) Parts of cash registers & calculating 7525 (3.9%) Control & peripheral 7763 (2.5%) Diodes 7788 (2.2%)
machines hardware & transistors Other electrical 7499 8741
machinery &
equipment N.E.S. 5530 5831
6954 (0.86%) (0.75%)
Perfumery &
7431 cosmetics
7643 (2.9%) Television & radio 8973 3354 5121 (0.72%)
transmitters 7518 (1%) 7528 7929 (1.7%) 7131
Office machines Aircraft
7768 (6.1%) Parts N.E.S. of electronic circuits N.E.S. 7722 equipment 1124
7712 (0.9%) parts N.E.S. 5823 0488
7649 (2.7%) Parts of telecom & 7781
sound recording equipment 7853
7523 7938 8851
5833
* Numbers indicate SITC-4 rev 2 codes. Parenthesis indicate percentage of total exports. Treemap Headers show: Total Trade/Total World Trade (share of world trade represented by the country).