Page 294 - The Atlas of Economic Complexity
P. 294

MAPPING PATHS TO PROSPERITY  |  295


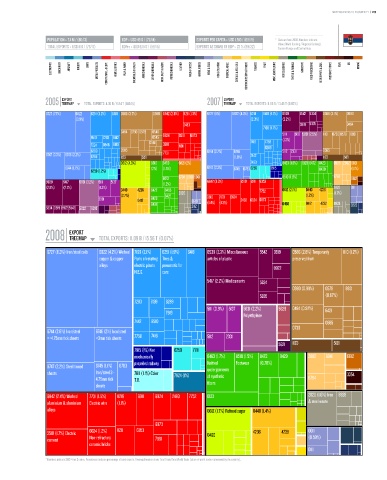
                   POPULATION ≥ 7.4 M / (80/13)  GDP ≥ USD 49 b / (72/14)  EXPORTS PER CAPITA ≥ USD 1,510 / (68/19)  *   Data are from 2008. Numbers indicate:
                                                                                                          value (World Ranking / Regional Ranking).
                   TOTAL EXPORTS ≥ USD 11 b / (76/17)  GDPpc ≥ USD 6,647 / (59/15)  EXPORTS AS SHARE OF GDP ≥ 23 % (89/22)    Eastern Europe and Central Asia.

                    ELECTRONICS  MACHINERY  AIRCRAFT   bOILERS   SHIPS   METAL PRODUCTS  CONSTR. MATL. & EqPT.  HOME & OFFICE  PULP & PAPER  CHEMICALS & HEALTH  AGROCHEMICALS  OTHER CHEMICALS  INOR. SALTS & ACIDS  PETROCHEMICALS  LEATHER  MILK & CHEESE  ANIMAL FIbERS  MEAT & EGGS  FISH & SEAFOOD  TROPICAL AGRIC.  CEREALS & vEG. OILS  COTTON/RICE/SOY & OTHERS  TObACCO  FRUIT  MISC. AGRICULTURE  NOT CLASSIFIED  TEXTILE & FAbRICS  GARMENTS  FOOD PROCESSING  bEER/SPIRITS & CIGS.  PRECIOUS STONES  COAL  OIL  MINING


                        EXPORT                                                      EXPORT
                  2005 TREEMAP  TOTAL EXPORTS: 4.36 b / 9.84 T (0.04%)        2007 TREEMAP   TOTAL EXPORTS: 8.85 b / 13.45 T (0.07%)
                                         Total Exports: 4.36 B / 9.84 T (0.04%)                      Total Exports: 8.85 B / 13.45 T (0.07%)
                  6727 (7.7%)  6822  6251 (3.2%)  6418 0586 (3.7%)  0980 6842 (2.8%)  8211 (1.3%)  6727 (6%)  6822 (4.3%) 6251  6418 (1.7%) 8939  5542 5334  0586 (3.1%)  0980
                             (3.9%)                                                           (2.3%)      (2.2%)
                                                                     2483                                        0819 5335        0484
                                                                                                   7169 (1.7%)
                                              0484 0730 0579  0546                                        5111  5137 5831 (2.5%)  1110  0730 0579 8931
                                   9510  7283 7442        0545  6624  8219  6973                          (1.3%)
                                   7224  8946 7493       0561  3510  6911                     7416  7758
                                                                                                    6289
                                   6289       0585                            6744 (2.7%)  6746           5112 2331      0585
                  6747 (3.3%) 6746 (2.2%)                     7731                            7442
                                   6785       1123    5121                              (1.8%)                           1123    5121
                                              0612 (4.3%)  8510  8463  6821 (2%)              7493        8463 (1.8%) 6123 8472 8423  6998 2882 6821
                         6744 (1.7%)                     (2%)  (1.5%)         6747 (2.3%)  6745 6783 6259  7915         8439        (1.1%)
                                   6259 (1.2%)
                                                              6123  6794 69986861                         8510 (1.6%)        6794   6612
                  8939   5417  5831 (3.2%) 5111  5137         (1.2%)          6842 (3.3%)  8219 8211 6353
                  (2.8%)  (2.7%)      (1.3%)                                                                                 2820   0111
                                              0440  4236  8472  8465  2820                        7752    0612 (2.1%)  0440  4236  (1.7%)
                                              (2.7%)          8422            3510  7731  6624                     (1.2%)
                                      2331          0412  8423          0149               2483 6924 6973
                                                         8431                 (1.4%) (1.3%)               0460     0412  4232  8928  0223
                  5334 0819 8922 5542 5832  6210                        2112


                           EXPORT
                  2008 TREEMAP        TOTAL EXPORTS: 11.09 b / 15.56 T (0.07%)
                                                                 Total Exports: 11.09 B / 15.56 T (0.07%)
                   6727 (6.3%) Iron/steel coils  6822 (4.2%) Worked 7169 (2.1%)  6251 (1.9%)  6418  8939 (2.3%) Miscellaneous  5542  0819  0586 (2.8%) Temporarily  1110 (1.2%)
                                      copper & copper  Parts of rotating Tires &  articles of plastic         preserved fruit
                                      alloys       electric plants  pneumatic for                      8922
                                                   N.E.S.    cars

                                                                              5417 (2.2%) Medicaments  5334
                                                                                                              0980 (0.99%)  0579  8931
                                                                                                  5335                    (0.67%)
                                                   7283  7139  6289
                                                                              5111 (0.9%) 5137  5831 (2.2%)  5629  0484 (0.97%)  6421
                                                               7919
                                                                                            Polyethylene
                                                   7442  9510                                                             0585
                                                                                                              0730
                   6744 (2.6%) Iron/steel  6746 (2%) Iron/steel
                   >=4.75mm tick sheets  <3mm tick sheets  7758  7416         5112   2331
                                                                                                         5621  1123          5121
                                                   7915 (1%) Not  6259   7711
                                                   mechanically               8463 (1.7%)  8510 (1.5%)  8472  8429  2882  6841    6612
                                                   propelled railway          Knitted    Footwear  (0.78%)
                   6747 (2.2%) Steel tinned  6745 (1.1%)  6783                undergarments
                   sheets            Iron/steel 3 -  for freight  7924 (1%)   of synthetic                                        3354
                                                   7611 (1.1%) Color
                                     4.75mm tick   T.V.                                                             6794
                                     sheets                                   fibers

                   6842 (2.4%) Worked  7731 (1.5%)  8219  6911  6924  2483  7752  6123                              2820 (1.6%) Iron 8928
                   aluminium & aluminium  Electric wire  (1.1%)                                                     & steel waste
                   alloys                                                     0612 (1.7%) Refined sugar  0440 (1.4%)


                                                           6973
                   3510 (1.7%) Electric  6624 (1.2%)  8211  6353              0460             4236       4239      0011
                   current        Non-refractory           7861                                                     (0.59%)
                                  ceramic bricks
                                                                                                                    0111
                  * Numbers indicate SITC-4 rev 2 codes. Parenthesis indicate percentage of total exports. Treemap Headers show: Total Trade/Total World Trade (share of world trade represented by the country).
   289   290   291   292   293   294   295   296   297   298   299