
Page 338 - The Atlas of Economic Complexity
P. 338
MAPPING PATHS TO PROSPERITY | 339
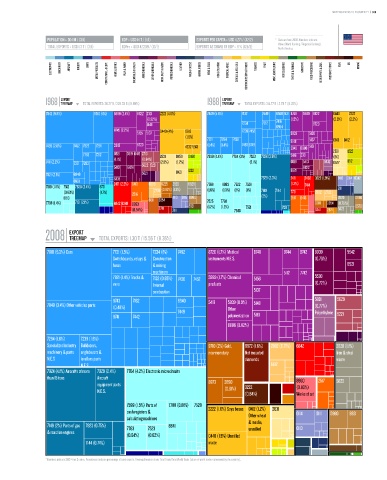
POPULATION ≥ 304 M / (3/1) GDP ≥ USD 14 T / (1/1) EXPORTS PER CAPITA ≥ USD 4,271 / (42/2) * Data are from 2008. Numbers indicate:
value (World Ranking / Regional Ranking).
TOTAL EXPORTS ≥ USD 1.3 T / (3/1) GDPpc ≥ USD 47,209 / (13/1) EXPORTS AS SHARE OF GDP ≥ 9 % (125/2) North America.
ELECTRONICS MACHINERY AIRCRAFT bOILERS SHIPS METAL PRODUCTS CONSTR. MATL. & EqPT. HOME & OFFICE PULP & PAPER CHEMICALS & HEALTH AGROCHEMICALS OTHER CHEMICALS INOR. SALTS & ACIDS PETROCHEMICALS LEATHER MILK & CHEESE ANIMAL FIbERS MEAT & EGGS FISH & SEAFOOD TROPICAL AGRIC. CEREALS & vEG. OILS COTTON/RICE/SOY & OTHERS TObACCO FRUIT MISC. AGRICULTURE NOT CLASSIFIED TEXTILE & FAbRICS GARMENTS FOOD PROCESSING bEER/SPIRITS & CIGS. PRECIOUS STONES COAL OIL MINING
EXPORT EXPORT
1968 TREEMAP TOTAL EXPORTS: 36.27 b / 228.33 b (15.89%) 1988 TREEMAP TOTAL EXPORTS: 314.77 b / 2.79 T (11.26%)
Total Exports: 36.27 B / 228.33 B (15.89%) Total Exports: 314.77 B / 2.79 T (11.26%)
7842 (9.8%) 9510 (4%) 5989 (2.4%) 8822 2331 2222 (4.6%) 7849 (5.6%) 7132 7449 6940 7431 8748 5989 8822 0440 2222
(0.92%) 7416 (1.5%) (2.6%) (2.3%)
5148 7234 7212 6954 8720
8745 (2.2%) 0440 (4%) 0813 7239 7452
5155 5137 5839 5138
(1.6%)
7721 7284 7139 5148 5137 0813 0412
7499 (2.8%) 7452 7822 7281 3345 8720 4232 5513 (1.4%) (1.4%) 7493 8749 3345 8996 5161
7783 7212 8921 0819 6419 2713 2631 0459 0460 7599 (4.4%) 7764 (3%) 7523 7924 (3.9%) 5416 2331 2631 1222
(1%)
(1.1%) (0.84%)
7411 (2.2%) 7371 7283 (2.8%) (1.2%) (2.1%) 0819 5413 5832 0577 1212
5413 6424 5622 5221 1222 8921 8922
7821 (2.1%) 6940 5621 0421 7929 (2.3%)
6991 5335 6998 5225 2820 8928 2471 2483 3222 (1.9%) 0116 0114 0342
(1.2%)
2471 (2.2%) 6413
7518 (1.8%) 7512 7928 (2.4%) 8731 (0.82%)(1.3%) 7768 8983 7522 7528 7414 2111
(0.83%) (1.7%) 2516 2789 (1.6%) (1.3%) (1%) (1%) 7149 7144 7731 2882 2782
8813 6811 3354 4113 0116 0980 (2%) 2517 6413 2820 0980
7788 (1.4%) 7131 (2.1%) 6842 6349 6953 5121 7525 7788 9710 3354 (0.76%) 0579
(0.94%) 2741 2111 (1.2%) (1.2%) 7648 7521 7131 5241 2871 5823
EXPORT
2008 TREEMAP TOTAL EXPORTS: 1.30 T / 15.56 T (8.36%)
Total Exports: 1.30 T / 15.56 T (8.36%)
7810 (5.3%) Cars 7721 (1.5%) 7234 (1%) 7492 8720 (1.7%) Medical 8748 8744 8742 8939 5542
Switchboards, relays & Construction instruments N.E.S. (0.76%)
fuses & mining 8921
machinery 5112 7742
7821 (1.4%) Trucks & 7132 (0.85%) 7436 7452 5989 (1.7%) Chemical 5156 5530
vans Internal products (0.72%)
combustion 5137
8743 7162 engines for 6940 5416 5839 (0.9%) 5831 5629
7849 (3.4%) Other vehicles parts (0.48%) motor vehicles 5148 (0.77%)
7449 Other Polyethylene
8741 7442 polymerization 5161 5221
&
8996 (0.82%)
copolymarization
products
7284 (1.6%) 7239 (1.6%)
Specialized industry Bulldozers, 9710 (2%) Gold, 6672 (1.6%) 2882 (0.71%) 6842 2820 (1.1%)
machinery & parts angledozers & non-monetary Not mounted Iron & steel
N.E.S levellers parts diamonds waste
N.E.S. 6812
7924 (4.1%) Aircrafts of more 7929 (2.4%) 7764 (4.2%) Electronic microcircuits
than 15 tons Aircraft 8960 2517 5823
equipment parts 8973 2890 3222 (0.83%)
N.E.S. (0.61%)
(0.84%) Works of art
7599 (1.5%) Parts of 7788 (0.81%) 7528
cash registers & 2222 (1.6%) Soya beans 0412 (1.2%) 2631 0114 0111 0980 8931
calculating machines Other wheat
7149 (2%) Parts of gas 7923 (0.75%) 7763 7523 8841 & meslin, 0113
unmilled
& reaction engines
(0.84%) (0.82%) 0440 (1.5%) Unmilled
7144 (0.74%) maize
* Numbers indicate SITC-4 rev 2 codes. Parenthesis indicate percentage of total exports. Treemap Headers show: Total Trade/Total World Trade (share of world trade represented by the country).