
Page 340 - The Atlas of Economic Complexity
P. 340
MAPPING PATHS TO PROSPERITY | 341
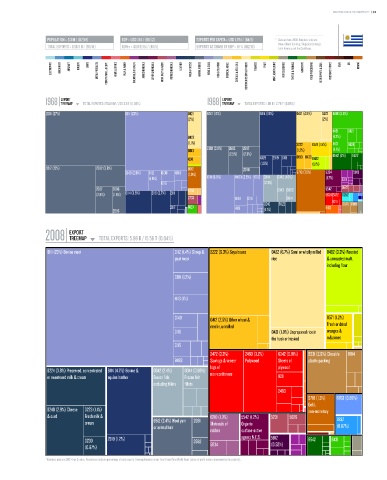
POPULATION ≥ 3.3 M / (112/19) GDP ≥ USD 31 b / (80/12) EXPORTS PER CAPITA ≥ USD 1,794 / (64/6) * Data are from 2008. Numbers indicate:
value (World Ranking / Regional Ranking).
TOTAL EXPORTS ≥ USD 6 b / (90/14) GDPpc ≥ USD 9,351 / (48/5) EXPORTS AS SHARE OF GDP ≥ 19 % (102/16) Latin America and the Caribbean.
ELECTRONICS MACHINERY AIRCRAFT bOILERS SHIPS METAL PRODUCTS CONSTR. MATL. & EqPT. HOME & OFFICE PULP & PAPER CHEMICALS & HEALTH AGROCHEMICALS OTHER CHEMICALS INOR. SALTS & ACIDS PETROCHEMICALS LEATHER MILK & CHEESE ANIMAL FIbERS MEAT & EGGS FISH & SEAFOOD TROPICAL AGRIC. CEREALS & vEG. OILS COTTON/RICE/SOY & OTHERS TObACCO FRUIT MISC. AGRICULTURE NOT CLASSIFIED TEXTILE & FAbRICS GARMENTS FOOD PROCESSING bEER/SPIRITS & CIGS. PRECIOUS STONES COAL OIL MINING
EXPORT EXPORT
1968 TREEMAP TOTAL EXPORTS: 176.88 M / 228.33 b (0.08%) 1988 TREEMAP TOTAL EXPORTS: 1.50 b / 2.79 T (0.05%)
Total Exports: 176.88 M / 228.33 B (0.08%) Total Exports: 1.50 B / 2.79 T (0.05%)
2681 (27%) 0111 (23%) 0421 6512 (12%) 6114 (10%) 0421 (4.9%) 0422 8481 (3.3%)
(2%) (2%)
8451 8421
0422 (1.2%)
(1.1%) 2222 0571 (1.5%) 8431 8424
2681 (3.9%) 2682 2687 (1.1%)
0813 (1.2%)
(2.5%) (2.3%) 6542 (2%) 6522
4241 6129 2919 6113 0813 0430 0482
(1.5%) (1.1%)
6512 (15%) 2682 (3.9%) 6612 2686
0149 (2.9%) 0112 6130 0011 (1.9%) 9710 (7.6%) 5334 5913
(1.6%) 0111 (6.8%) 8483 (2.6%) 0012 0344 0342 (1.6%) (1.7%) 5311
0116 (2.3%)
2687 2686 2734 0343 0360 5542 5622
(2.8%) (1.8%) 6114 (3.8%) 2116 (2.7%) 2111 66242472 6252
2733 0149 0116 0814
0240 5922 8211 0579 0980
2117 6123 4113 6412
2685 (1.1%)
EXPORT
2008 TREEMAP TOTAL EXPORTS: 5.98 b / 15.56 T (0.04%)
Total Exports: 5.98 B / 15.56 T (0.04%)
0111 (23%) Bovine meat 0112 (1.4%) Sheep & 2222 (6.3%) Soya beans 0422 (6.7%) Semi or wholly milled 0482 (3.3%) Roasted
goat meat rice & unroasted malt,
including flour
0011 (1.2%)
4113 (1%)
0149 0412 (2.5%) Other wheat & 0571 (1.2%)
meslin, unmilled Fresh or dried
0116 0421 (1.8%) Unprepared rice in oranges &
the husk or husked m&arines
0115
2472 (3.3%) 2460 (3.2%) 6342 (0.91%) 8931 (2.6%) Closable 0914
8483 Sawlogs & veneer Pulpwood Sheets of plastic packing
logs of plywood
0224 (3.6%) Preserved, concentrated 6114 (4.7%) Bovine & 0342 (2.4%) 0344 (0.86%) non-coniferous
or sweetened milk & cream equine leather Frozen fish, Frozen fish 8211
excluding fillets fillets
2483
9710 (1.3%) 6783 (0.89%)
Gold,
0240 (2.9%) Cheese 0223 (1.1%) non-monetary
& curd Fresh milk & 6210 (1.3%) 5542 (1.2%) 5231 5629 7832
cream 6512 (2.4%) Wool yarn 2681 Materials of Organic
or animal hair (0.67%)
rubber surface-active
0230 2919 (1.2%) 2682 agents N.E.S. 5912 6542 8431
(0.67%) 5834 (0.52%)
* Numbers indicate SITC-4 rev 2 codes. Parenthesis indicate percentage of total exports. Treemap Headers show: Total Trade/Total World Trade (share of world trade represented by the country).