
Page 93 - The Atlas of Economic Complexity
P. 93
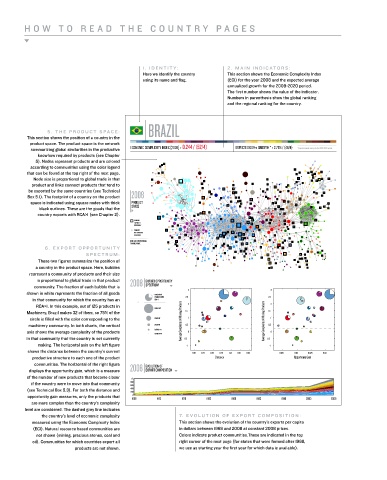
h o W   t o   r e a D   t h e   C o U n t r y   p a g e s


                                                      1 .   I D E n T I T Y :         2 .   M A I n   I n D I C AT O R S :
                                                      here we identify the country    this section shows the economic Complexity index
                                                      using its name and flag.        (eCi) for the year 2008 and the expected average
                                                                                      annualized growth for the 2009-2020 period.
                                                                                      the first number shows the value of the indicator.
                                                                                      numbers in parenthesis show the global ranking
                                                                                      and the regional ranking for the country.


                                                        bRazIl
                   5 .   T h E   P R O D U C T   S P A C E :
           this section shows the position of a country in the
            product space. the product space is the network
            summarizing global similarities in the productive   ECONOMIC COMPLEXITY INDEX [2008] ≥ 0.244 / (52/4)  EXPECTED GDPpc GROWTH * ≥ 2.73% / (48/8)  *Expected annual average for the 2009-2020 period.
               knowhow required by products (see Chapter
              5). nodes represent products and are colored
            according to communities using the color legend
           that can be found at the top right of the next page.
             node size is proportional to global trade in that
             product and links connect products that tend to
            be exported by the same countries (see technical
           Box 5.1). the footprint of a country on the product   2008
            space is indicated using square nodes with thick   PRODUCT
                black outlines. these are the goods that the   SPACE
               country exports with rCa>1 (see Chapter 2).
                                                   PRODUCT
                                                   EXPORTED
                                                   WITH RCA>1
                                                   PRODUCT
                                                   NOT EXPORTED
                                                   WITH RCA>1
                                                  NODE SIzE IS PROPORTIONAL
                                                  TO WORLD TRADE
                  6 .   E X P O R T   O P P O R T U n I T Y
                                 S P E C T R U M :
               these two figures summarize the position of
              a country in the product space. here, bubbles
            represent a community of products and their size
               is proportional to global trade in that product   EXPORT OPPORTUNITY
              community. the fraction of each bubble that is   2008 SPECTRUM
                                                                       3                              3
           shown in white represents the fraction of all goods   FRACTION OF
                                                           PRODUCTS WITH   2.5                       2.5
             in that community for which the country has an   RCA > 1
              rCa>1. in this example, out of 125 products in           2                              2
                                                           22% OF WT
           Machinery, Brazil makes 32 of them, so 75% of the          1.5                            1.5
            circle is filled with the color corresponding to the   6% OF WT  Average Complexity of Missing Products  1  Average Complexity of Missing Products  1
            machinery community. in both charts, the vertical   2% OF WT  0.5                        0.5
                                                           0.8% OF WT
           axis shows the average complexity of the products   0.06% OF WT  0                         0
           in that community that the country is not currently        -0.5                          -0.5
               making. the horizontal axis on the left figure         -1                             -1
           shows the distance between the country’s current              0.76  0.77  0.78  0.79  0.8  0.81  0.82  0.015  0.02  0.025  0.03
             productive structure to each one of the product                     Distance                      Opportunity Gain
              communities. the horizontal of the right figure   EvOLUTION OF
            displays the opportunity gain, which is a measure  2008 EXPORT COMPOSITION
           of the number of new products that become closer   1 k
             if the country were to move into that community   800
                                                  600
           (see technical Box 5.3). For both the distance and   400
                                                  200
           opportunity gain measures, only the products that   0
                                                  1968     1973      1978     1983     1988     1993      1998     2003     2008
             are more complex than the country’s complexity
          level are considered. the dashed grey line indicates
                 the country’s level of economic complexity         7.   E v O L U T I O n   O f   E X P O R T   C O M P O S I T I O n :
             measured using the economic Complexity index           this section shows the evolution of the country’s exports per capita
             (eCi). natural resource based communities are          in dollars between 1968 and 2008 at constant 2008 prices.
              not shown (mining, precious stones, coal and          Colors indicate product communities.these are indicated in the top
             oil). Communities for which countries export all       right corner of the next page (for states that were formed after 1968,
                             products are not shown.                we use as starting year the first year for which data is available).