
Page 90 - The Atlas of Economic Complexity
P. 90
MAPPING PATHS TO PROSPERITY | 91
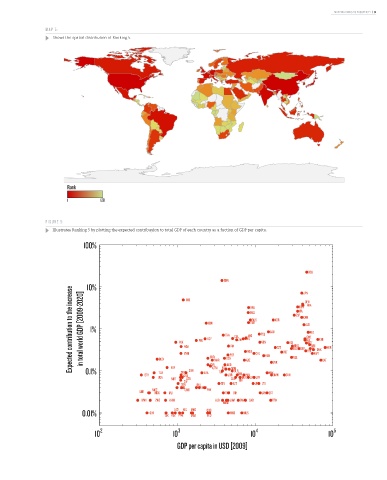
MAP 5:
Shows the spatial distribution of Ranking 5.
Rank
1 128
FIGURE 5:
Illustrates Ranking 5 by plotting the expected contribuyion to total GDP of each country as a fuction of GDP per capita.
100%
USA
CHN JPN
10%
Expected contribution to the increase in total world GDP [2009-2020] 1% PAK NGA PHL EGY THA IRN COL ZAF MYS ARG MEX POL SAU KOR PRT ISR GRC SGP CAN SWE NLD DNK CHE NOR
IND
DEU
FRA
GBR
BRA
ITA
ESP
RUS
TUR
IDN
AUS
BEL
VEN
AUT
ARE
HKG
CZE
IRL
FIN
ROU
KAZ
MAR
AGO
SYR
DOM
0.1%
TZA
OMN
JOR
ETH BGD KEN YEM VNM SDN LKA UKR GTM TUN ECU DZA PER BLR SRB PAN CHL HUN HRV SVK SVN NZL KWT QAT
GHA
UGA MRT UZB CUB CRI BGR LBN LBY
SEN CIV BOL SLV AZE URY LTU
ZMB HND
LBR MOZ MLI CMR PRY TKM BIH LVA EST
MDG
MWI ZWE KHM ALB JAM BWA GAB TTO
NAM
LAO
0.01% GIN TJK KGZ PNG NIC MNG COG MKD MUS
GEO
MDA
10 2 10 3 10 4 10 5
GDP per capita in USD [2009]