
Page 94 - The Atlas of Economic Complexity
P. 94
MAPPING PATHS TO PROSPERITY | 95
3 . T R A D I T I O n A L I n D I C AT O R S :
this section shows a small set of indicators that
can be used to put the country in context. For each
indicator, the first number shows its value and
the numbers in parenthesis show the country’s
corresponding global and regional ranking.
the region the country belongs to is shown to
the right of the indicators. 4 . P R O D U C T C O M M U n I T I E S :
this legend shows the colors used to indicate the
community to which each product belongs. these
are the colors used to identify product communities
in the product space, export opportunity
spectrum, evolution of export Composition and
export treemap sections of the country page.
POPULATION ≥ 192 M / (5/1) GDP ≥ USD 1.7 T / (9/1) EXPORTS PER CAPITA ≥ USD 1,031 / (77/11) * Data are from 2008. Numbers indicate:
TOTAL EXPORTS ≥ USD 198 b / (21/2) GDPpc ≥ USD 8,609 / (50/6) EXPORTS AS SHARE OF GDP ≥ 12 % (120/20) value (World Ranking / Regional Ranking).
Latin America and the Caribbean.
ELECTRONICS MACHINERY AIRCRAFT bOILERS SHIPS METAL PRODUCTS CONSTR. MATL. & EqPT. HOME & OFFICE PULP & PAPER CHEMICALS & HEALTH AGROCHEMICALS OTHER CHEMICALS INOR. SALTS & ACIDS PETROCHEMICALS LEATHER MILK & CHEESE ANIMAL FIbERS MEAT & EGGS FISH & SEAFOOD TROPICAL AGRIC. CEREALS & vEG. OILS COTTON/RICE/SOY & OTHERS TObACCO FRUIT MISC. AGRICULTURE NOT CLASSIFIED TEXTILE & FAbRICS GARMENTS FOOD PROCESSING bEER/SPIRITS & CIGS. PRECIOUS STONES COAL OIL MINING
EXPORT EXPORT
1968 TREEMAP TOTAL EXPORTS: 2.17 b / 228.33 b (0.95%) 1988 TREEMAP TOTAL EXPORTS: 37.39 b / 2.79 T (1.34%)
Total Exports: 2.17 B / 228.33 B (0.95%) Total Exports: 37.39 B / 2.79 T (1.34%)
0711 (47%) 2631 (8.1%) 0577 2482 (4.6%) 0813 (8.2%) 0711 (8.6%) 2815 (5.5%) 2816 2517 6412
(1.2%) (2.4%) (2%) 6415
2654
(1.2%) 6413
0422 2472 6649 2873 6732 6342
6841 (3.7%)
0149 0111 2681 2222 (3.1%) 4232 1212 (1.7%) 0723 0577 (1.1%)
(0.88%) 2483
0440 0813 4245 2120 0721 0611 0811 8510 (4.8%) 6513 6871 0712
(3.7%) (2.2%) (2%) 0115 (1.1%)
0360 6725 (3.2%) 6727 (1.7%) 7821 (1.9%) 6731 7431
5831
2877 6673 7224 6521 (0.88%)
2222 5513 (1.7%) 6712 (1.5%)
2879 7139 6251 7259
0721 0723 0611 6716 (1.4%) 6746 6745 7842 7138 0111 0149 6114 0585 (4.7%)
(2.7%) (1.8%) (1.5%) 0712 6725 7132 (1.4%) (1.2%)
(1.3%) (1.3%) 2919
0612 4314 0573 0585 6744 (1.4%) 6724 6747 7621 6252 7923 0114 0360
2814
EXPORT
2008 TREEMAP TOTAL EXPORTS: 198.08 b / 15.56 T (1.27%)
Total Exports: 198.08 B / 15.56 T (1.27%)
7849 (2.5%) Other 7821 7234 (1.2%) 6725 (2.9%) 6712 (2.2%) Pig & cast iron 2815 (7.9%) Not agglomerated iron ore 0114 (4.3%) Poultry meat
vehicles parts (1.6%) Construction & Iron/steel billets
mining machinery
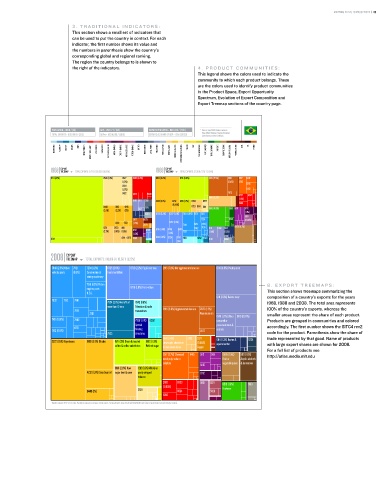
7139 (1.2%) Piston 8 . E X P O R T T R E E M A P S :
engines parts 6716 (1.6%) Ferro-alloys
N.E.S. this section shows treemaps summarizing the
0111 (2.9%) Bovine meat composition of a country’s exports for the years
7832 7132 7841
7924 (3.1%) Aircrafts of 7643 (1.6%) 1968, 1988 and 2008. the total area represents
more than 15 tons Television & radio
7169 transmitters 2816 (3.9%) Agglomerated iron ore 2873 (1.3%) 100% of the country’s exports, whereas the
7212 Aluminium ore
0149 (1.7%) Other 0113 (0.97%) smaller areas represent the share of each product.
7431 (0.61%) 7842 7938 (1.1%) 6252 prepared or products are grouped in communities and colored
Special preserved meat &
6731 floating entrails accordingly. the first number shows the sitC4 rev2
7162 (0.6%) 2877
7923 structures code for the product. parenthesis show the share of
6841 (1.4%) 2782 2871 trade represented by that good. name of products
2222 (7.8%) Soya beans 0813 (3.1%) Oilcake 0711 (3%) Green & roasted 0612 (1.3%) Unwrought aluminium (0.85%) 6114 (1.3%) Bovine & 0224
coffee & coffee substitutes Refined sugar & aluminium alloys Copper equine leather with large export shares are shown for 2008.
For a full list of products see
2517 (2.7%) Chemical 6415 5112 5161 0585 (1.5%) 5121 (1.8%) http://atlas.media.mit.edu
wood pulp, soda or Fruit or Acyclic alcohols
sulphate 5146 vegetable juices & derivatives
0611 (2.6%) Raw 1212 (1.8%) Wholly or
4232 (1.9%) Soya bean oil sugar beet & cane partly stripped 0712
tobacco
2483 6353 5831 5221 8510 (1.3%) 6613
(0.65%) Footwear
0440 (1%) 2631 6624 5629
6342
* Numbers indicate SITC-4 rev 2 codes. Parenthesis indicate percentage of total exports. Treemap Headers show: Total Trade/Total World Trade (share of world trade represented by the country).