
Page 32 - PowerPoint
P. 32
Markets 31
THURSDAY JULY 26, 2018 • THEEDGE FINANCIAL DAILY
FU TURE S . MONEY MARKET . COMMODITIE S
Index futures Money market
FKLI Long Rolls - KLCI futures EURO Klibor
Index points Open Interest Index points Euro/USD Implied interest rate (%)
1980 1,763.00 90000 18.00 -1.50 1.58 4.5
(+1.00) (+1.00) 3.73
(Unch)
1785 68000 4.75 1.44
3.5
1.1698
1590 46000 -8.50 1.30 (+0.0014)
2.5
1395 24000 -21.75 1.16
1200 2000 -35.00 1.02 1.5
Jan 4, 2010 July 25, 2018 Jan 4, 2010 July 25, 2018 Jan 2, 2006 July 25, 2018 Oct 1, 2000 July 25, 2018
FBM KLCI futures contracts FBM KLCI futures Euro inches up ahead of Klibor
end mostly higher INDEX AND FUTURES OPEN CHANGE IN Trump-Juncker talks MONTH SETTLEMENT CHANGE VOLUME OPEN
CONTRACT LAST CHANGE VOLUME INTEREST OPEN INTEREST PRICE INTEREST
The FBM KLCI futures contracts on Bursa FBMKLCI 1,763.78 0.85 112.7M The euro edged higher yesterday ahead of AUG8 96.27 — — —
Malaysia Derivatives ended mostly higher JUL 18 1,763.00 1.00 7,794 33,861 -88 a meeting between US President Donald SEP8 96.27 — — —
96.27
—
DEC8
—
—
yesterday, tracking the performance of the AUG 18 1,761.50 2.00 3,295 4,409 109 Trump and European Commission MAR9 96.22 — — —
underlying cash market. SEP 18 1,758.50 -0.50 77 1,015 51 president Jean-Claude Juncker but gains JUN9 96.22 — — —
-3
1.00
267
23
1,758.50
DEC 18
Spot month July 2018 and distant month TOTAL 11,189 39,552 69 were limited with investors cautious about SEP9 96.22 — — —
December 2018 rose one point each to 1,763 a trade rift between the two powers. DEC9 96.22 — — —
—
—
—
MAR0
96.22
BID
and 1,758.5 respectively; while August 2018 FUTURES ROLL OVER -1.0 OFFER CLOSE Lack of clarity over where a brewing JUN0 96.22 — — —
-1.5
JUL/AUG
-1.5
gained two points to 1,761.5, and September US-European trade conflict is heading kept SEP0 96.22 — — —
2018 eased 0.5 of a point to 1,758.5. FUTURES FAIR VALUE most major currencies, including the US DEC0 96.22 — — —
Turnover rose to 11,189 lots from 5,197 CONTRACT DAYS TO EXPIRY KLIBOR DIVIDEND FAIR VALUE dollar, range-bound yesterday as Juncker MAR1 96.22 — — —
7
JUL 18
0.99
0.00
0.99
JUN1
—
—
—
96.22
lots on Tuesday, while open interest widened AUG 18 37 5.96 4.84 1.12 travelled to Washington for trade-focused SEP1 96.22 — — —
to 39,552 contracts from 33,021 contracts ROLL’S FAIR 0.13 talks with Trump. The talks come after the DEC1 96.22 — — —
previously. US imposed tariffs on European Union (EU) MAR2 96.22 — — —
The underlying benchmark FBM KLCI steel and aluminium, and Trump’s threats JUN2 96.22 — — —
finished 0.85 of a point better at 1,763.78. to extend those measures to EU-made cars. SEP2 96.22 — — —
—
—
96.22
—
DEC2
Most Southeast Asian stock markets rose The single currency was up 0.1% at MAR3 96.22 — — —
yesterday tracking strong broader Asia, with US$1.1698. The US dollar versus a basket JAN-00 — — — —
Singapore shares gaining more than 1% led Around the region, MSCI’s Asia ex-Japan of major currencies traded broadly fl at at JAN-00 — — — —
by fi nancials. stock index was firmer by 0.39%. — Agencies 94.52. — Reuters TOTAL 0 0
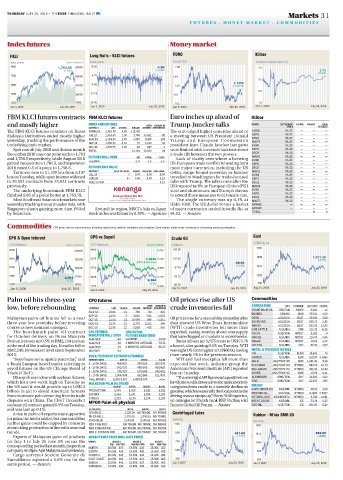
Commodities CPO prices react to various factors including soyoil prices, weather conditions and stockpiles. Open interest shows either increasing or decreasing market participation.
CPO & Open Interest CPO vs Soyoil Crude Oil Gold
US$/troy oz
CPO RM/tonne Open Interest CPO RM/tonne Soyoil US$/Ibs US$/bbl
1980
4200 200000 6400 0.700 155.00
1660 1,231.40
3450 152500 5075 0.2849 0.525 121.25 (+5.90)
(RM2,546/tonne) 68.60
(+0.08)
2700 105000 3750 0.350 87.50 1340
1950 57500 2425 53.75 1020
2,164 0.175
(+12) 2,164
1200 10000 (+12) 20.00 700
1100 0.000
Jan 6, 2008 July 25, 2018 Apr 10, 2007 July 25, 2018 Aug 31, 2008 July 25, 2018
Jan 6, 2008 July 25, 2018
Palm oil hits three-year CPO futures Oil prices rise after US Commodities
low, before rebounding CONTRACT LAST CHANGE VOLUME INTEREST OPEN INTEREST crude inventories fall AGRICULTURE UNIT EXCHANGE LAST PRICE CHANGE
OPEN
CHANGE IN
AUG-18 2,106 11 720 -20 -201 CRUDE PALM OIL RM/TON MDEX 2,164 12
SEP-18 2,150 7 3,816 -916 -1,563 RUBBER SEN/KG MRB 533.00 6.50
Malaysian palm oil futures fell to a near OCT-18 2,164 12 19,969 899 -1,561 Oil prices rose for a second day yesterday after CORN USC/BSH CBOT 355.00 3.00
three-year low yesterday before reversing NOV-18 2,179 11 8,778 2,012 249 data showed US West Texas Intermediate SOYBEANS USC/BSH CBOT 855.75 -2.25
course as new demand emerged. DEC-18 2,198 12 2,880 -438 565 (WTI) crude inventories fell more than WHEAT USC/BSH CBOT 523.50 13.25
CME
LIVE CATTLE
USC/IBS
-0.28
110.33
The benchmark palm oil contract CPO FUTURES CPO/SOYOIL expected, easing worries about oversupply COCOA US$/TON NYBOT 2,282 -4
for October delivery on Bursa Malaysia INDICATIVE ROLL-OVER FUTURES BASIS (USD) -74.29 that have dragged on markets in recent weeks. COFFEE USC/IBS NYBOT 114.70 0.45
AUG/SEP
CURRENT
-44
Derivatives was up 0.5% to RM2,164 a tonne AUG/OCT -58 3 MONTHS AVERAGE -72.71 Brent oil was up 32 US cents to US$73.76 SUGAR USC/IBS NYBOT 12.03 0.07
at the end of the trading day. It earlier fell to AUG/NOV -73 6 MONTHS AVERAGE -85.37 a barrel, after gaining 0.5% on Tuesday. WTI COTTON USC/IBS NYC 87.26 0.57
RM2,140, its weakest level since September SEP/OCT -14 was eight US cents higher at US$68.60, having METAL & PRECIOUS METALS
2015. SGS & ITS EXPORT ESTIMATES (TONNES) risen nearly 1% in the previous session. TIN US$/TON KLTM 19,600 70
CMX
COPPER
USC/IBS
2.8170 0.0065
“Soyoil saw some upside yesterday,” said SHIPMENT DAYS MAY’18 JUN’18 JUL’18 WTI and fuel stockpiles fell more than GOLD US$/TROY OZ CMX 1,231.40 5.90
a Kuala Lumpur-based trader, referring to 1 - 10TH DAYS 409/407 334/325 257/278 expected last week, industry group the PLATINUM US$/TROY OZ NYMEX 844.50 10.70
soyoil futures on the US Chicago Board of 1 - 15TH DAYS 551/539 498/500 455/487 American Petroleum Institute (API) reported PALLADIUM US$/TROY OZ NYMEX 921.80 16.60
745/737
Trade (CBoT). 1 - 20TH DAYS 1,004/984 670/690 692/681 late on Tuesday. SILVER USC/TROY OZ CMX 15.59 0.11
1 - 25TH DAYS
862/860
911/903
US soyoil rose in line with soybean futures, FULL MONTH 1,200/1,197 1,059/1,073 —/— “The overnight API figures set a positive tone ALUMINIUM RMB/TON SHF 14,360 -110
which hit a two-week high on Tuesday as MALAYSIAN PALM OIL BOARD for oil prices, with draws across the main inventory ZINC RMB/TON SHF 21,075 -295
the US said it would provide up to US$12 MAR’18 APR’18 MAY’18 JUN’18 categories from crude to a sizeable decline in ENERGY US$/BBL NYMEX 68.60 0.08
LIGHT CRUDE OIL
billion in aid to shield American farmers PRODUCTION 1,574 1,558 1,525 1,332 gasoline, which is seasonally the focal point as the HEATING OIL USC/GAL NYMEX 2.1486 0.0107
from economic pain stemming from its trade EXPORT 1,566 1,541 1,290 1,129 driving season ramps up,” Harry Tchilinguirian, NATURAL GAS US$/MMBTU NYMEX 2.740 0.021
STOCKS
2,323
2,187
2,174
2,170
disputes with China. The CBoT December MPOB Palm oil physical oil strategist for French bank BNP Paribas, told BRENT CRUDE US$/BBL ICE 73.76 0.32
soybean oil contract gained 0.9% on Tuesday, Reuters Global Oil Forum. — Reuters GAS OIL US$/TON ICE 656.00 0.25
and was last up 0.1%. (IN RM/TON) JUL’18 AUG’18 SEP’18
A rise in palm oil exports was supportive CPO DELD 2,130.00 NO TRADE NO TRADE Centrifuged Latex Rubber - M’sia SMR 20
PK EX-MILL 1,770.00 1,740.00 NO TRADE
for palm, the trader added, but cautioned that CPKO DELD 3,570.00 3,555.00 NO TRADE Sen/Kg Sen/Kg
further gains could be capped by concerns RBD P.OIL FOB NO TRADE NO TRADE NO TRADE 1100 1900
about rising production in line with seasonal RBD P.OLEIN FOB NO TRADE NO TRADE NO TRADE
trends. RBD P. STEARIN FOB NO TRADE NO TRADE NO TRADE 900 421.00 1475 533.00
Exports of Malaysian palm oil products MPOB FFB REF PRICE (MILL GATE PRICE) (+5.50) (+6.50)
for July 1 to July 25 rose 5% versus the REGION GRADE A GRADE B GRADE C 700 1050
OER (RM/TON) OER (RM/TON)
corresponding period last month, inspection OER (RM/TON) 19.00% 434 18.00% 413
NORTH 20.00% 455
company AmSpec Agri Malaysia said yesterday. SOUTH 20.00% 466 19.00% 445 18.00% 423 500 625
Cargo surveyor Societe Generale de CENTRAL 20.00% 465 19.00% 444 18.00% 423
Surveillance reported a 5.6% rise for the EAST COAST 20.00% 462 19.00% 441 18.00% 420 300 200
same period. — Reuters SABAH 22.00% 446 21.00% 427 20.00% 408 Jan 7, 2007 July 25, 2018 Jan 7, 2007 July 25, 2018
SARAWAK 22.00% 452 21.00% 433 20.00% 413