
Page 28 - GeoPRISMS_Newsletter_Spring2019_42_Neat
P. 28
Status Report on the GeoPRISMS Data Portal: April, 2019
Andrew Goodwillie and the IEDA Database Team
Lamont-Doherty Earth Observatory, Columbia University
The GeoPRISMS data portal (http://www.marine-geo.org/portals/geoprisms/) was established in 2011 to provide convenient access to data
and information for each primary site as well as to other relevant data resources. Since the last newsletter report, highlighted below are
recent contributions of data sets and field program information of interest to the GeoPRISMS community. Many of the data sets described
are also available in GeoMapApp (http://www.geomapapp.org/) under the Focus Site and DataLayers menus.
East African Rift System
Grids of upper mantle isotropic seismic velocity structure beneath Africa were contributed by Erica Emry. Derived using new full-wave
seismic tomography techniques on ambient noise and earthquake data the grids shed light on relationships between mantle flow, cratonic
lithosphere and surface processes. The data set has been added to GeoMapApp (Fig. 1).
As part of an integrated study of tectonic and magmatic processes during the onset of rifting, also now available in the data portal is the
active-source seismic shot data from the 2015 SEGMeNT survey on Lake Malawi (Fig. 2). Led by Shillington et al. the survey focused
upon the northern Malawi (Nyasa) rift, a region of early-stage rifting in strong, cold lithosphere, and imaged sedimentary and crustal
structure within and around the lake. The data set is available at http://www.marine-geo.org/tools/search/entry.php?id=EARS_SEGMeNT
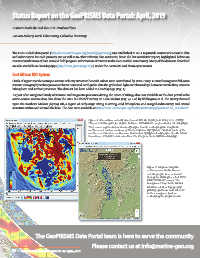
Figure 1. Shear-wave velocity structure at 123 km depth from Emry et al. (2018).
This, and similar grids for depths between 105-424 km are provided in GeoMapApp.
They reveal segmented, low-velocity upper mantle underlying the magmatic
northern and eastern sections of the East African Rift System. Shallow parts of the
southern and western sections are dominated by high-velocity upper mantle which
transitions at depth to low velocities. The image is made with GeoMapApp.
Figure 2. Map showing the
active-source multi-channel
seismic profile lines collected
during the Shillington et al. 2015
EARS SEGMeNT survey. The
background map is the Global
Multi-Resolution Topography
(GMRT) synthesis. Lake Malawi
is the even green feature
underlying the profile tracks
The GeoPRISMS Data Portal team is here to serve the community
Please contact us at info@marine-geo.org
28 • GeoPRISMS Newsletter Issue No. 42 Spring 2019