
Page 83 - analysis-and-interpretation-of-astronomical-sp
P. 83
Analysis and Interpretation of Astronomical Spectra 83
Inten-
sity
0 5000 10‘000 15‘000 20‘000
Wavelength [Å]
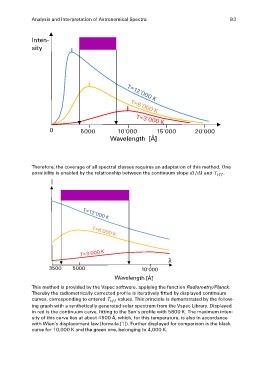
Therefore, the coverage of all spectral classes requires an adaptation of this method. One
possibility is enabled by the relationship between the continuum slope and .
I
λ
This method is provided by the Vspec software, applying the function Radiometry/Planck.
Thereby the radiometrically corrected profile is iteratively fitted by displayed continuum
curves, corresponding to entered values. This principle is demonstrated by the follow-
ing graph with a synthetically generated solar spectrum from the Vspec Library. Displayed
in red is the continuum curve, fitting to the Sun’s profile with 5800 K. The maximum inten-
sity of this curve lies at about 4900 Å, which, for this temperature, is also in accordance
with Wien’s displacement law (formula {1}). Further displayed for comparison is the black
curve for 10,000 K and the green one, belonging to 4,000 K.