
Page 23 - More Higher algebra
P. 23
As you scroll through the display using the R key you
will see the data values. Now copy these into a table.
x 2 2.5 3 3.5 4 4.5
f(x) .95 1.2 1.3 1.26 1.15 1.0
x 5 5.5 6 6.5 7
f(x) .83 .67 .53 .41 .31
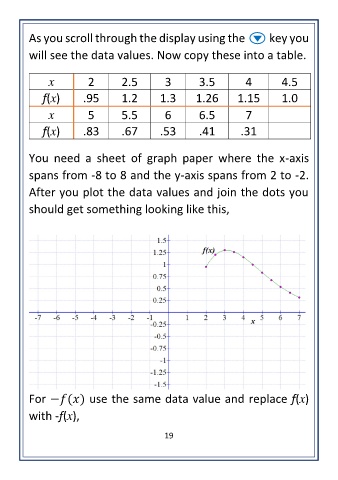
You need a sheet of graph paper where the x-axis
spans from -8 to 8 and the y-axis spans from 2 to -2.
After you plot the data values and join the dots you
should get something looking like this,
For − ( ) use the same data value and replace f(x)
with -f(x),
19