
Page 390 - Budget Book FY2020-2021
P. 390
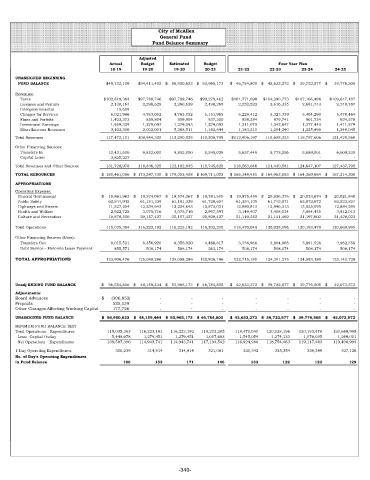
City of McAllen
                                                      General Fund
                                                   Fund Balance Summary


                                               Adjusted
                                     Actual     Budget   Estimated  Budget                   Four Year Plan
                                     18-19      19-20     19-20      20-21      21-22     22-23      23-24      24-25
      UNASSIGNED BEGINNING
        FUND BALANCE                $48,732,108  $54,411,405  $     56,950,623  $    53,965,173  $     46,784,805  $     42,633,272  $     39,722,577   $     39,776,505
      Revenues:
        Taxes                      $102,819,384  $97,789,746  $97,789,746  $99,279,462  $101,771,698  $104,290,773  $107,166,498  $109,617,107
        Licenses and Permits                2,130,164           2,290,629          2,290,629           2,490,265          2,552,522            2,616,335    2,681,743    2,748,787
        Intergovernmental                 15,609      -         -         -           -         -          -          -
        Charges for Services                6,021,986           4,763,052          4,763,052           5,151,985          5,229,412            5,323,339    5,404,290    5,478,464

        Fines and Forfeits                  1,423,373    859,804    859,804    837,350    858,284  879,741    901,734    924,278
        Investment Earnings                 1,959,329           1,279,093          1,279,093           1,279,093          1,311,070            1,343,847    1,377,443    1,411,879
        Miscellaneous Revenues              3,102,306           2,002,001          5,268,511           1,162,644          1,183,210            1,204,290    1,225,898    1,248,045
      Total Revenues                    117,472,151       108,984,325       112,250,835      110,200,799  $112,906,197       115,658,325       118,757,606          121,428,560
      Other Financing Sources:
        Transfers In                      10,431,600           9,852,000          9,852,000           5,545,029          5,657,449            5,772,256    5,889,501    6,009,235
        Capital Lease                       3,825,227  -        -         -           -         -          -          -
      Total Revenues and Other Sources       131,728,978       118,836,325       122,102,835      115,745,828       118,563,646       121,430,581       124,647,107          127,437,795
      TOTAL RESOURCES              $   180,461,086  $   173,247,730  $   179,053,458  $  169,711,002  $   165,348,451  $   164,063,853  $    164,369,684  $     167,214,300
      APPROPRIATIONS
      Operating Expense:
       General Government          $     18,861,963  $     19,574,067  $     19,574,067  $    19,781,500  $     19,975,459  $     20,836,376  $     20,033,674   $     20,021,840
       Public Safety                      62,844,942         61,181,339         61,181,339        61,729,654         61,354,109         61,745,571         62,072,672           62,523,824
       Highways and Streets               11,527,254         12,234,643         12,234,643        12,873,031         12,880,813         12,896,313         13,025,095           12,884,295
       Health and Welfare                   2,922,725           3,075,716          3,075,716           2,997,593          3,149,407            3,408,534    3,864,435    3,812,013
       Culture and Recreation             18,878,500         20,157,427         20,157,427        20,820,427         21,110,252         21,141,402         21,197,602           21,428,023
      Total Operations                  115,035,384       116,223,192       116,223,192      118,202,205       118,470,040       120,028,196       120,193,478          120,669,995
      Other Financing Sources (Uses):
        Transfers Out                       8,015,521           8,356,920          8,356,920           4,460,817          3,736,966            3,804,905    3,891,528    3,962,558
        Debt Service - Motorola Lease Payment    855,571    508,174    508,174    263,174    508,174    508,174    508,174    508,174
      TOTAL APPROPRIATIONS              123,906,476       125,088,286       125,088,286      122,926,196       122,715,180       124,341,275       124,593,180          125,140,728


      Unadj ENDING FUND BALANCE    $     56,554,610  $     48,159,444  $     53,965,173  $    46,784,805  $     42,633,272  $     39,722,577  $     39,776,505   $     42,073,572
      Adjustments:
      Board Advances               $     (306,852)    -         -         -           -         -          -          -
      Prepaids                          525,139       -         -         -           -         -          -          -
      Other Changes Affecting Working Capital    177,726  -     -         -           -         -          -          -
      UNASSIGNED FUND BALANCE      $    56,950,623  $    48,159,444  $   53,965,173  $   46,784,805  $   42,633,272  $   39,722,577   $    39,776,505  $     42,073,572
      MINIMUM FUND BALANCE TEST
      Total Operations - Expenditures  115,035,383  116,223,191  116,223,192  118,202,205  118,470,040  120,028,196  120,193,478  120,669,995
       Less:  Capital Outlay          5,448,078  1,279,451  1,279,451  1,007,663  1,545,054  1,274,133  1,076,035  1,269,001
       Net Operations - Expenditures  109,587,306  114,943,741  114,943,741  117,194,542  116,924,986  118,754,063  119,117,443  119,400,994
      1 Day Operating Expenditures     300,239    314,914   314,914     321,081  320,342    325,354    326,349    327,126
      No. of Day's Operating Expenditures
      in Fund Balance                     190       153        171       146        133       122        122        129


                                                            -340-