
Page 393 - Budget Book FY2020-2021
P. 393
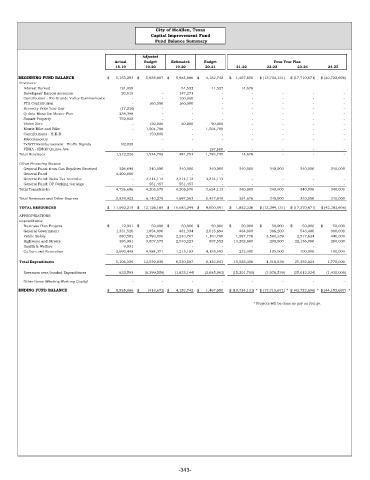
City of McAllen, Texas
                                                 Capital Improvement Fund
                                                  Fund Balance Summary


                                              Adjusted
                                     Actual   Budget   Estimated  Budget                 Four Year Plan
                                     18-19     19-20     19-20     20-21     21-22     22-23     23-24     24-25
     BEGINNING FUND BALANCE       $       5,153,293  $       5,985,887  $       5,985,886  $       4,152,742  $      1,467,650  $   (13,734,131)  $   (17,710,671)  $   (42,722,696)
     Revenues:
      Interest Earned                    124,859    -      54,522       41,527      14,676  -         -         -

      Developers' Escrow accounts         20,515    -       147,271     -         -         -         -         -
      Contribution - Rio Grande Valley Communicatio  -     -       100,000  -     -         -         -         -
      FTA Contribution                    -       160,000    160,000    -         -         -         -         -
      Recovery Prior Year Exp            (17,210)   -         -         -         -         -         -         -
      Quinta Mazatlán Master Plan        238,398    -         -         -         -         -         -         -
      Sunset Property                    752,825    -         -         -         -         -         -         -
      Vision Zero                         -     120,000       30,000      90,000  -         -         -         -

      Morris Hike and Bike                -      1,504,708    -       1,504,708   -         -         -         -
      Contributions : H-E-B                        150,000    -         -         -         -         -         -
      Miscellaneous                       -         -         -         -         -         -         -         -
      TxDOT Reimbursement - Traffic Signals      92,839  -     -        -         -         -         -         -
      FEMA - HMGP Quince Ave              -         -         -         157,500   -         -         -         -
     Total Revenues                     1,212,226      1,934,708      491,793      1,793,735      14,676  -     -     -
     Other Financing Souces:
      General Fund: from Gas Royalties Received      326,696      340,000      340,000      340,000      340,000      340,000      340,000      340,000
      General Fund                      4,400,000   -         -         -
      General Fund: Sales Tax Incentive   -      3,314,113      3,314,113      3,314,113  -     -     -         -
      General Fund: DP Parking Garange    -       551,457      551,457  -         -         -         -         -
     Total Transfers-In                 4,726,696      4,205,570      4,205,570      3,654,113      340,000      340,000      340,000      340,000
     Total Revenues and Other Sources      5,938,922      6,140,278      4,697,363      5,447,848      354,676      340,000      340,000      340,000
     TOTAL RESOURCES              $      11,092,215  $      12,126,165  $      10,683,249  $       9,600,591  $      1,822,326  $   (13,394,131)  $   (17,370,671)  $   (42,382,696)
     APPROPRIATIONS
     Expenditures:
      Business Plan Projects      $        12,931  $        50,000  $        50,000  $        50,000  $        50,000  $       50,000   $        50,000  $        50,000
      General Government                1,331,526      1,854,890      481,334      2,015,694     484,000       386,200      548,400      980,000
      Public Safety                      680,502      2,593,000      2,243,767      1,103,700      1,587,776      3,580,339      2,517,624      440,000
      Highways and Streets               380,991      3,057,575      2,540,223      807,552      13,202,680      200,000      22,136,000      200,000
      Health & Welfare                     9,931    -         -         -         -         -         -         -
      Culture and Recreation            2,690,448      4,984,371      1,215,183      4,155,995     232,000       100,000      100,000      100,000
     Total Expenditures                 5,106,329      12,539,836      6,530,507      8,132,941      15,556,456      4,316,539      25,352,024      1,770,000
      Revenues over/(under) Expenditures      832,593     (6,399,558)     (1,833,144)     (2,685,093)      (15,201,780)      (3,976,539)      (25,012,024)      (1,430,000)
      Other Items Affecting Working Capital  -      -         -         -         -         -         -         -
     ENDING FUND BALANCE          $       5,985,886  $       (413,672) $       4,152,742  $       1,467,650  $   (13,734,131) * $   (17,710,671) * $   (42,722,696) * $   (44,152,697) *

                                                                                   * Projects will be done as pay as you go.


                                                          -343-