
Page 395 - Budget Book FY2020-2021
P. 395
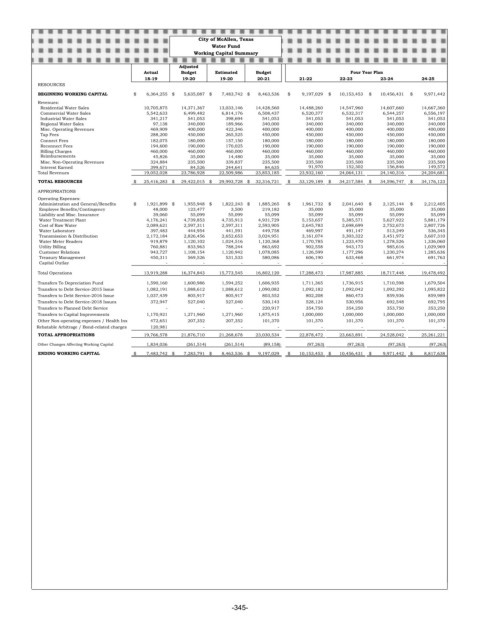
City of McAllen, Texas
                                                     Water Fund
                                                Working Capital Summary
                                            Adjusted
                                   Actual    Budget  Estimated  Budget                  Four Year Plan
                                   18-19     19-20     19-20    20-21      21-22     22-23      23-24     24-25
        RESOURCES
        BEGINNING WORKING CAPITAL  $         6,364,255  $        5,635,087   $         7,483,742  $        8,463,536  $          9,197,029  $        10,153,453  $        10,456,431  $          9,971,442
        Revenues:
          Residential Water Sales           10,705,875          14,371,367            13,033,146          14,428,560            14,488,260            14,547,960            14,607,660            14,667,360
          Commercial Water Sales             5,542,633            6,499,482              6,814,176            6,508,437              6,520,377              6,532,317              6,544,257              6,556,197
          Industrial Water Sales       341,217  541,053     398,694               541,053    541,053    541,053    541,053    541,053

          Regional Water Sales         97,138  340,000     189,966               340,000    340,000  340,000    340,000    340,000
          Misc. Operating Revenues     469,909  400,000     422,346               400,000    400,000    400,000    400,000    400,000
          Tap Fees                     288,200  450,000     265,525               450,000    450,000  450,000    450,000    450,000

          Connect Fees                 182,075  180,000     157,150               180,000    180,000    180,000    180,000    180,000
          Reconnect Fees               194,600  190,000     170,025               190,000    190,000    190,000    190,000    190,000
          Billing Charges              460,000  460,000     460,000               460,000    460,000    460,000    460,000    460,000
          Reimbursements               45,826  35,000      14,480    35,000    35,000    35,000     35,000    35,000

          Misc. Non-Operating Revenues    324,884  235,500     339,837               235,500    235,500  235,500    235,500    235,500
          Interest Earned              399,671  84,526     244,641    84,635    91,970    152,302    156,846    149,572
        Total Revenues                    19,052,028          23,786,928            22,509,986          23,853,185            23,932,160            24,064,131            24,140,316            24,204,681
        TOTAL RESOURCES          $       25,416,283  $      29,422,015   $       29,993,728  $      32,316,721  $        33,129,189  $        34,217,584  $        34,596,747  $        34,176,123
        APPROPRIATIONS
        Operating Expenses:
         Administration and General/Benefits  $         1,921,899  $        1,955,948   $         1,822,243  $        1,885,265  $          1,961,732  $          2,041,640  $          2,125,144  $          2,212,405

         Employee Benefits/Contingency    48,000  123,477   3,500               219,182    35,000    35,000    35,000    35,000
         Liability and Misc. Insurance    39,060  55,099     55,099    55,099    55,099    55,099    55,099    55,099
         Water Treatment Plant              4,176,241            4,739,853              4,735,913            4,931,729              5,153,657              5,385,571              5,627,922              5,881,179
         Cost of Raw Water                  2,089,621            2,597,311              2,597,311            2,593,905              2,645,783              2,698,699              2,752,673              2,807,726
         Water Laboratory              397,483  444,954     441,591               449,758    469,997    491,147    513,249    536,345
         Transmission & Distribution             2,172,184            2,826,456              2,652,653            3,024,951              3,161,074              3,303,322              3,451,972              3,607,310
         Water Meter Readers           919,879            1,120,102              1,024,516            1,120,368              1,170,785              1,223,470              1,278,526              1,336,060
         Utility Billing               760,881  833,963     788,244               863,692    902,558    943,173    985,616              1,029,969
         Customer Relations            943,727            1,108,154              1,120,942            1,078,085              1,126,599              1,177,296              1,230,274              1,285,636
         Treasury Management           450,311  569,526     531,533               580,086    606,190  633,468    661,974    691,763

         Capital Outlay                  -        -         -        -           -         -         -          -
        Total Operations                  13,919,288          16,374,843            15,773,545          16,802,120            17,288,473            17,987,885            18,717,448            19,478,492
        Transfers To Depreciation Fund             1,590,160            1,600,986              1,594,252            1,606,935              1,711,365              1,736,915              1,710,598              1,679,504
        Transfers to Debt Service-2015 Issue             1,082,191            1,088,612              1,088,612            1,090,082              1,092,182              1,092,042              1,092,392              1,095,822
        Transfers to Debt Service-2016 Issue             1,037,439  805,917     805,917               803,552    802,208    860,473    859,936    859,989
        Transfers to Debt Service-2018 Issues    372,947  527,040     527,040               530,143    528,124    530,956    692,548    692,795
        Transfers to Planned Debt Service  -      -         -                 220,917    354,750    354,250    353,750    353,250
        Transfers to Capital Improvements             1,170,921            1,271,960             1,271,960            1,875,415               1,000,000              1,000,000              1,000,000              1,000,000
        Other Non-operating expenses / Health Ins    472,651  207,352     207,352               101,370    101,370  101,370    101,370    101,370

        Rebatable Arbitrage / Bond-related charges    120,981  -    -    -       -         -         -          -
        TOTAL APPROPRIATIONS              19,766,578          21,876,710            21,268,678          23,030,534            22,878,472            23,663,891            24,528,042            25,261,221
        Other Changes Affecting Working Capital             1,834,036              (261,514)                (261,514)  (89,158)   (97,263)   (97,263)   (97,263)    (97,263)

        ENDING WORKING CAPITAL   $         7,483,742  $        7,283,791   $         8,463,536  $        9,197,029  $        10,153,453  $        10,456,431  $          9,971,442  $          8,817,638


                                                          -345-