Page 387 - Applied Statistics with R
P. 387

16.1. QUALITY CRITERION                                           387


                      set.seed(1234)
                      poly_data = make_poly_data()


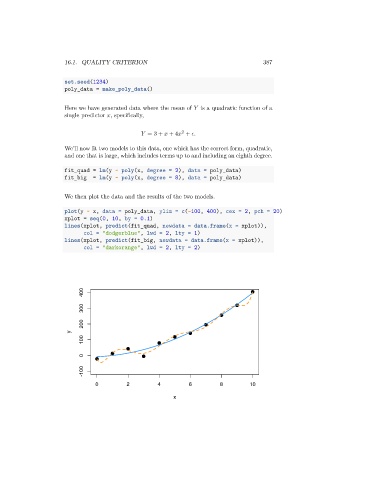
                      Here we have generated data where the mean of    is a quadratic function of a
                      single predictor   , specifically,


                                                             2
                                                   = 3 +    + 4   +   .
                      We’ll now fit two models to this data, one which has the correct form, quadratic,
                      and one that is large, which includes terms up to and including an eighth degree.
                      fit_quad = lm(y ~ poly(x, degree = 2), data = poly_data)
                      fit_big   = lm(y ~ poly(x, degree = 8), data = poly_data)


                      We then plot the data and the results of the two models.

                      plot(y ~ x, data = poly_data, ylim = c(-100, 400), cex = 2, pch = 20)
                      xplot = seq(0, 10, by = 0.1)
                      lines(xplot, predict(fit_quad, newdata = data.frame(x = xplot)),
                             col = "dodgerblue", lwd = 2, lty = 1)
                      lines(xplot, predict(fit_big, newdata = data.frame(x = xplot)),
                             col = "darkorange", lwd = 2, lty = 2)


                             400


                             300

                             200
                        y
                             100


                             0

                             -100

                                 0         2         4          6         8         10
                                                          x
   382   383   384   385   386   387   388   389   390   391   392