
Page 390 - Applied Statistics with R
P. 390
390 CHAPTER 16. VARIABLE SELECTION AND MODEL BUILDING
400
300
200
y
100
0
-100
0 2 4 6 8 10
x
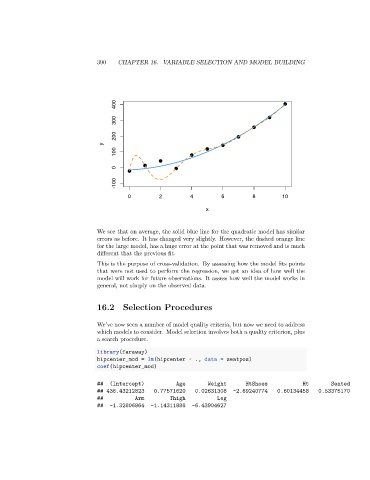
We see that on average, the solid blue line for the quadratic model has similar
errors as before. It has changed very slightly. However, the dashed orange line
for the large model, has a huge error at the point that was removed and is much
different that the previous fit.
This is the purpose of cross-validation. By assessing how the model fits points
that were not used to perform the regression, we get an idea of how well the
model will work for future observations. It assess how well the model works in
general, not simply on the observed data.
16.2 Selection Procedures
We’ve now seen a number of model quality criteria, but now we need to address
which models to consider. Model selection involves both a quality criterion, plus
a search procedure.
library(faraway)
hipcenter_mod = lm(hipcenter ~ ., data = seatpos)
coef(hipcenter_mod)
## (Intercept) Age Weight HtShoes Ht Seated
## 436.43212823 0.77571620 0.02631308 -2.69240774 0.60134458 0.53375170
## Arm Thigh Leg
## -1.32806864 -1.14311888 -6.43904627