
Page 44 - ATR 3 2013
P. 44
S TaT V I e W
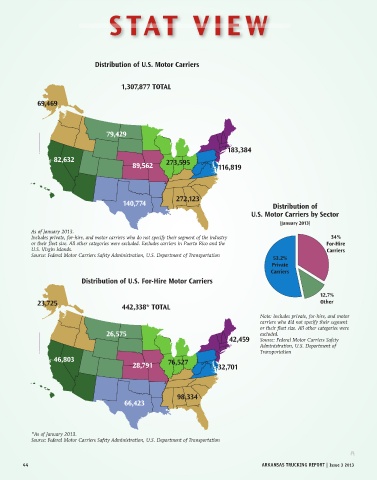
distribution of U.S. motor carriers
1,307,877 ToTal
69,469
79,429
183,384
82,632 273,595
89,562 116,819
272,123
140,774 distribution of
U.S. motor carriers by Sector
(January 2013)
As of January 2013.
Includes private, for-hire, and motor carriers who do not specify their segment of the industry 34%
or their fleet size. All other categories were excluded. Excludes carriers in Puerto Rico and the for-Hire
U.S. Virgin Islands. carriers
Source: Federal Motor Carriers Safety Administration, U.S. Department of Transportation 53.2%
private
carriers
distribution of U.S. for-Hire motor carriers
12.7%
23,725 other
442,338* ToTal
Note: Includes private, for-hire, and motor
carriers who did not specify their segment
or their fleet size. All other categories were
26,575 excluded.
42,459 Source: Federal Motor Carriers Safety
Administration, U.S. Department of
Transportation
46,803 76,527
28,791 32,701
98,334
66,423
*As of January 2013.
Source: Federal Motor Carriers Safety Administration, U.S. Department of Transportation
44 arkansas Trucking reporT | issue 3 2013