
Page 48 - ATR 2 2020 digital
P. 48
S TAT VIE W
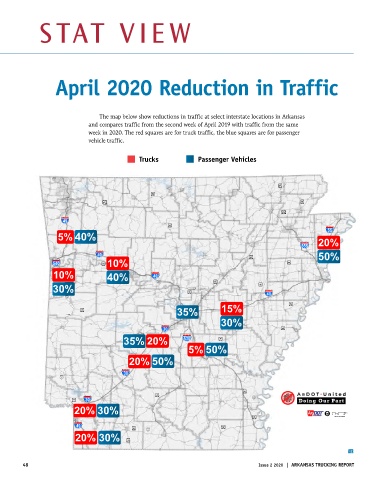
April 2020 Reduction in Traffic
The map below show reductions in traffic at select interstate locations in Arkansas
and compares traffic from the second week of April 2019 with traffic from the same
week in 2020. The red squares are for truck traffic, the blue squares are for passenger
vehicle traffic.
Trucks Passenger Vehicles
! # 49
FUTURE
I J
67
I J
62
49
K L I J
412
K L
412
! " # $
49
I J ! " # $
65
55
5% 40%
% & ' ( 20%
555
! " # $ I J 50%
40
67
% & ' ( I J 64 10% I J 64
540
10% 40% FUTURE ! # 49 ! " # $ I J 62 I J 67
40
67
30% ! " # $ K L 412 I J I J I J ! " # $ K L 412 I J 49
49
64
49
! # I J 65 40 ! " # $
FUTURE
55
49
5% 555 I J 20%
79
I J ! " # $ 6435% 15% I J 67 % & ' (
40
71
% & ' ( I J
"Y" City 540 I J 10% 64
10% ! " # $ 30%
40
! " # $ I J 67 I J 49 I J
30
49
40
! # FUTURE 49 I J 64 ! " # $
35% 20% % & ' ( I J 79 15% I J 79 Reduction in Truck Volumes at Select Locations
530
I J
71
"Y" City
5% 50% I J 49
! " # $
30
530
20% 50% 20% % & ' ( 5% I J 79 Percentage Change in
Truck Traffic
! " # $ FUTURE ! " # $ 20% % April 2019 to April 2020 Decrease
30
30
Second Week of Month
FUTURE
! # 49 ! # 49 I J ! I J 79 I J 65 ! # FUTURE 69
$
"
#
30
71
65
I J ! Document Path: H:\SystemInformation\System Information Group\GIS\SpecialRequests\COVID-19 Traffic for Governor\Truck_Percent_Maps\COVID 19 Traffic Differences Truck Percent Week 2.mxd I J 20% I J 82 FUTURE ! # 69 I J 82 I J FUTURE I J 65
$
"
79
#
! #
30
69
! " # $
71
49
20% 30% 20% I J 79 I 0 SIR:GIS: SH: 4/22/2020 20 Miles
10
5
! " # $ I J FUTURE 69 I J I J 65
49
82
82
! #
20% 30% I J
79
ATR 0 5
48 Issue 2 2020 | ARKANSAS TRUCKING REPORT