
Page 112 - Learn Africa 2021 Annual Report
P. 112
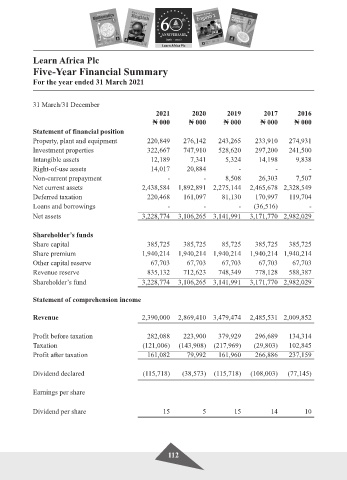
Learn Africa Plc
            Five-Year Financial Summary
            For the year ended 31 March 2021


            31 March/31 December
                                                       2021        2020        2019         2017       2016
                                                     ₦ 000        ₦ 000       ₦ 000       ₦ 000       ₦ 000
            Statement of financial position
            Property, plant and equipment           220,849     276,142     243,265      233,910    274,931
            Investment properties                   322,667     747,910     528,620      297,200     241,500
            Intangible assets                        12,189       7,341       5,324       14,198       9,838
            Right-of-use assets                      14,017      20,884            -            -          -
            Non-current prepayment                         -           -      8,508       26,303       7,507
            Net current assets                    2,438,584  1,892,891  2,275,144      2,465,678   2,328,549
            Deferred taxation                       220,468     161,097      81,130      170,997    119,704
            Loans and borrowings                           -           -           -    (36,516)           -
            Net assets                            3,228,774  3,106,265  3,141,991      3,171,770   2,982,029


            Shareholder’s funds
            Share capital                           385,725     385,725      85,725      385,725     385,725
            Share premium                         1,940,214   1,940,214  1,940,214     1,940,214   1,940,214
            Other capital reserve                    67,703      67,703      67,703       67,703      67,703
            Revenue reserve                         835,132     712,623     748,349      778,128     588,387
            Shareholder’s fund                    3,228,774   3,106,265  3,141,991     3,171,770   2,982,029


            Statement of comprehension income


            Revenue                               2,390,000   2,869,410  3,479,474     2,485,531   2,009,852


            Profit before taxation                  282,088     223,900     379,929      296,689     134,314
            Taxation                              (121,006)   (143,908)  (217,969)      (29,803)     102,845
            Profit after taxation                   161,082      79,992     161,960      266,886     237,159


            Dividend declared                     (115,718)     (38,573)  (115,718)    (108,003)   (77,145)


            Earnings per share


            Dividend per share                           15            5         15           14          10


                                                           112