
Page 111 - Learn Africa 2021 Annual Report
P. 111
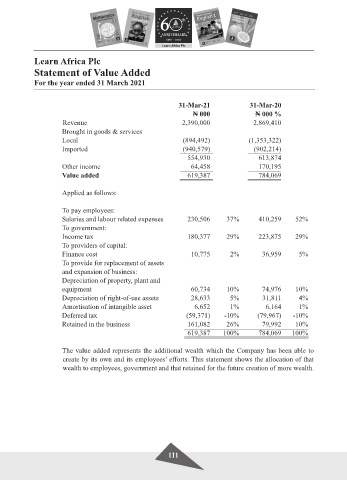
Learn Africa Plc
             Statement of Value Added

             For the year ended 31 March 2021


                                                              31-Mar-21                31-Mar-20
                                                                    ₦ 000                ₦ 000 %
                       Revenue                                  2,390,000               2,869,410
                      Brought in goods & services
                      Local                                     (894,492)             (1,353,322)
                      Imported                                  (940,579)               (902,214)
                                                                 554,930                  613,874
                      Other income                                 64,458                 170,195
                      Value added                                619,387                  784,069


                      Applied as follows:


                      To pay employees:
                      Salaries and labour related expenses       230,506       37%        410,259     52%
                      To government:
                      Income tax                                 180,377       29%        223,875     29%
                      To providers of capital:
                      Finance cost                                 10,775       2%         36,959       5%
                      To provide for replacement of assets
                      and expansion of business:
                      Depreciation of property, plant and
                      equipment                                    60,734      10%         74,976     10%
                      Depreciation of right-of-use assets          28,633       5%         31,811       4%
                      Amortisation of intangible asset              6,652       1%          6,164       1%
                      Deferred tax                               (59,371)     -10%       (79,967)     -10%
                      Retained in the business                   161,082       26%         79,992     10%
                                                                 619,387      100%        784,069    100%


                      The value added represents the additional wealth which the Company has been able to
                       create by its own and its employees’ efforts. This statement shows the allocation of that
                       wealth to employees, government and that retained for the future creation of more wealth.


                                                           111