
Page 115 - Learn Africa 2021 Annual Report
P. 115
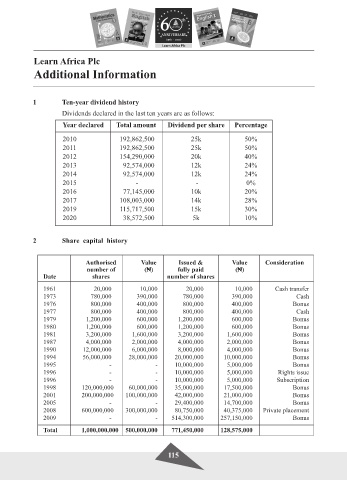
Learn Africa Plc
             Additional Information


            1         Ten-year dividend history

                      Dividends declared in the last ten years are as follows:

                       Year declared     Total amount      Dividend per share    Percentage

                       2010               192,862,500              25k               50%
                       2011               192,862,500              25k               50%
                       2012               154,290,000              20k               40%
                       2013                 92,574,000             12k               24%
                       2014                 92,574,000             12k               24%
                       2015                     -                    -                0%
                       2016                 77,145,000             10k               20%
                       2017               108,003,000              14k               28%
                       2019               115,717,500              15k               30%
                       2020                 38,572,500             5k                10%


            2         Share  capital  history


                              Authorised         Value        Issued &           Value      Consideration
                              number of            ($)        fully paid          ($)
                Date             shares                   number of shares

                1961             20,000          10,000          20,000           10,000        Cash transfer
                1973            780,000         390,000         780,000          390,000               Cash
                1976            800,000         400,000         800,000          400,000             Bonus
                1977            800,000         400,000         800,000          400,000               Cash
                1979           1,200,000        600,000        1,200,000         600,000              Bonus
                1980           1,200,000        600,000        1,200,000         600,000              Bonus
                1981           3,200,000       1,600,000       3,200,000       1,600,000              Bonus
                1987           4,000,000       2,000,000       4,000,000       2,000,000              Bonus
                1990          12,000,000       6,000,000       8,000,000       4,000,000              Bonus
                1994          56,000,000      28,000,000     20,000,000       10,000,000              Bonus
                1995                   -               -     10,000,000        5,000,000              Bonus
                1996                   -               -     10,000,000        5,000,000         Rights issue
                1996                   -               -     10,000,000        5,000,000        Subscription
                1998          120,000,000     60,000,000     35,000,000       17,500,000              Bonus
                2001          200,000,000     100,000,000     42,000,000      21,000,000              Bonus
                2005                   -               -     29,400,000       14,700,000              Bonus
                2008          600,000,000     300,000,000     80,750,000      40,375,000    Private placement
                2009                   -               -      514,300,000     257,150,000             Bonus

                Total         1,000,000,000    500,000,000     771,450,000     128,575,000


                                                           115