
Page 97 - Learn Africa 2021 Annual Report
P. 97
Learn Africa Plc
Notes to the Financial Statements (cont’d)
For the year ended 31 March 2021
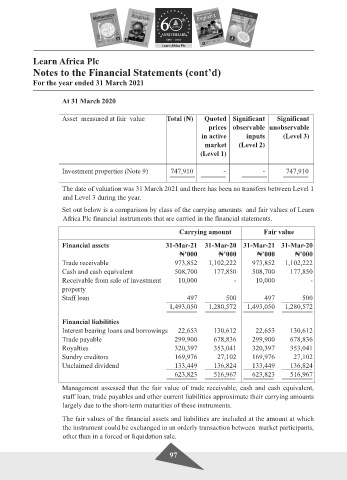
At 31 March 2020
Asset measured at fair value Total (₦) Quoted Significant Significant
prices observable unobservable
in active inputs (Level 3)
market (Level 2)
(Level 1)
Investment properties (Note 9) 747,910 - - 747,910
The date of valuation was 31 March 2021 and there has been no transfers between Level 1
and Level 3 during the year.
Set out below is a comparison by class of the carrying amounts and fair values of Learn
Africa Plc financial instruments that are carried in the financial statements.
Carrying amount Fair value
Financial assets 31-Mar-21 31-Mar-20 31-Mar-21 31-Mar-20
₦’000 ₦’000 ₦’000 ₦’000
Trade receivable 973,852 1,102,222 973,852 1,102,222
Cash and cash equivalent 508,700 177,850 508,700 177,850
Receivable from sale of investment 10,000 - 10,000 -
property
Staff loan 497 500 497 500
1,493,050 1,280,572 1,493,050 1,280,572
Financial liabilities
Interest bearing loans and borrowings 22,653 130,612 22,653 130,612
Trade payable 299,900 678,836 299,900 678,836
Royalties 320,397 353,041 320,397 353,041
Sundry creditors 169,976 27,102 169,976 27,102
Unclaimed dividend 133,449 136,824 133,449 136,824
623,823 516,967 623,823 516,967
Management assessed that the fair value of trade receivable, cash and cash equivalent,
staff loan, trade payables and other current liabilities approximate their carrying amounts
largely due to the short-term maturities of these instruments.
The fair values of the financial assets and liabilities are included at the amount at which
the instrument could be exchanged in an orderly transaction between market participants,
other than in a forced or liquidation sale.
97