
Page 77 - Template Tesis UTM v2.0
P. 77
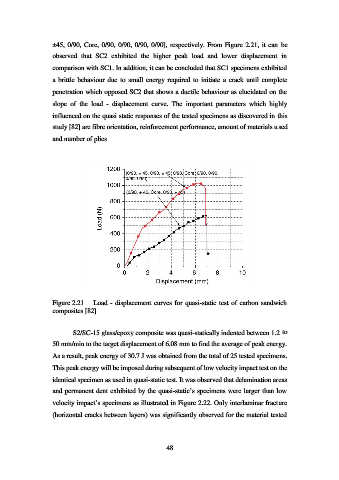
±45, 0/90, Core, 0/90, 0/90, 0/90, 0/90], respectively. From Figure  2.21, it can be

                   observed  that  SC2  exhibited  the  higher  peak  load  and  lower  displacement  in
                   comparison with SC1. In addition, it can be concluded that SC1 specimens exhibited

                   a  brittle  behaviour  due  to  small  energy  required  to  initiate  a  crack  until  complete
                   penetration which opposed SC2 that shows a ductile behaviour as elucidated on the

                   slope  of  the  load  -  displacement  curve.  The  important  parameters  which  highly
                   influenced on the quasi static responses of the tested specimens as discovered in this

                   study [82] are fibre orientation, reinforcement performance, amount of materials used

                   and number of plies


                   Figure 2.21    Load - displacement curves for quasi-static test  of carbon sandwich
                   composites [82]


                           S2/SC-15 glass/epoxy composite was quasi-statically indented between 1.2 to
                   50 mm/min to the target displacement of 6.08 mm to find the average of peak energy.

                   As a result, peak energy of 30.7 J was obtained from the total of 25 tested specimens.

                   This peak energy will be imposed during subsequent of low velocity impact test on the
                   identical specimen as used in quasi-static test. It was observed that delamination areas

                   and permanent dent exhibited by the quasi-static’s specimens were larger than low

                   velocity impact’s specimens as illustrated in Figure 2.22. Only interlaminar fracture
                   (horizontal cracks between layers) was significantly observed for the material tested


                                                           48