Page 12 - Spotlight A+ SPM Additional Mathematics Form 4 & 5
P. 12

Form
                                                                                                          4
                                                   Chapter 2  Quadratic Functions   Additional Mathematics

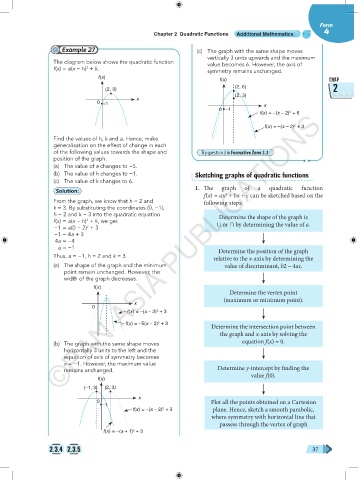
                     Example 27                                  (c)  The graph with the same shape moves
                                                                    vertically 3 units upwards and the maximum
                  The diagram below shows the quadratic function    value becomes 6. However, the axis of
                  f(x) = a(x − h)  + k.                             symmetry remains unchanged.
                             2
                                 f(x)
                                                                        f(x)                                CHAP
                                                                             (2, 6)                          2
                                   (2, 3)
                                                                             (2, 3)
                                             x
                                 0  –1                                                 x
                                                                        0 –1
                                                                                               2
                                                                                     f(x) = –(x – 2)  + 6
                    ©PAN ASIA PUBLICATIONS
                                                                                                 2
                                                                                       f(x) = –(x – 2)  + 3
                  Find the values of h, k and a. Hence, make
                  generalisation on the effect of change in each
                  of the following values towards the shape and    Try question 3 in Formative Zone 2.3
                  position of the graph.
                  (a)  The value of a changes to −5.
                  (b)  The value of h changes to −1.            Sketching graphs of quadratic functions
                  (c)  The value of k changes to 6.
                   Solution:                                     1.  The  graph  of  a   quadratic  function
                                                                   f(x) = ax  + bx + c can be sketched based on the
                                                                          2
                  From the graph, we know that h = 2 and           following steps:
                  k = 3. By substituting the coordinates (0, −1),
                  h = 2 and k = 3 into the quadratic equation           Determine the shape of the graph is
                  f(x) = a(x − h)  + k, we get                         ∪ or ∩ by determining the value of a.
                             2
                   −1 = a(0 − 2)  + 3
                             2
                   −1 = 4a + 3
                   4a = −4
                    a = −1                                              Determine the position of the graph
                  Thus, a = −1, h = 2 and k = 3.                      relative to the x-axis by determining the
                  (a)  The shape of the graph and the minimum             value of discriminant, b2 – 4ac.
                      point remain unchanged. However, the
                      width of the graph decreases.
                               f(x)
                                                                            Determine the vertex point
                                                                          (maximum or minimum point).
                                             x
                               0
                                                    2
                                          f(x) = –(x – 2)  + 3
                                          f(x) = –5(x – 2)  + 3
                                                    2
                                                                      Determine the intersection point between
                                                                        the graph and x-axis by solving the
                  (b)  The graph with the same shape moves                      equation f(x) = 0.
                      horizontally 3 units to the left and the
                      equation of axis of symmetry becomes
                      x = −1. However, the maximum value
                      remains unchanged.                                Determine y-intercept by finding the
                                                                                   value f(0).
                                 f(x)
                            (–1, 3)  (2, 3)
                                              x
                                 0                                    Plot all the points obtained on a Cartesion
                                  –1
                                            f(x) = –(x – 2)  + 3      plane. Hence, sketch a smooth parabolic,
                                                      2
                                                                      where symmetry with horizontal line that
                                                                   .    passess through the vertex of graph
                                            2
                                   f(x) = –(x + 1)  + 3
                 2.3.4 2.3.5                                                                           37
   7   8   9   10   11   12   13   14   15   16   17