
Page 26 - Spotlight A+ Physics Form 4.5
P. 26
Form
5
Chapter 7 Quantum Physics Physics
Data analysis:
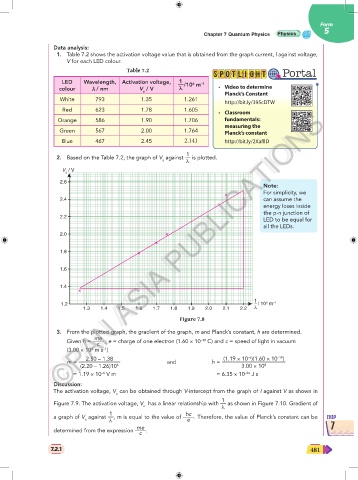
1. Table 7.2 shows the activation voltage value that is obtained from the graph current, l against voltage,
V for each LED colour.
Table 7.2
LED Wavelength, Activation voltage, 1
—/10 m –1 • Video to determine
6
colour λ λ / nm V / V λ λ
a
Planck’s Constant
White 793 1.35 1.261
http://bit.ly/395cDTW
Red 623 1.78 1.605
• Classroom
©PAN ASIA PUBLICATIONS
©PAN ASIA PUBLICATIONS
Orange 586 1.90 1.706 fundamentals:
measuring the
Green 567 2.00 1.764 Planck’s constant
Blue 467 2.45 2.141 http://bit.ly/2XafllD
1
2. Based on the Table 7.2, the graph of V against — is plotted.
a λ
V / V
a
2.6
Note:
For simplicity, we
2.4 can assume the
energy loses inside
the p-n junction of
2.2
LED to be equal for
all the LEDs.
2.0
1.8
1.6
1.4
1
6
1.2 – / 10 m –1
1.3 1.4 1.5 1.6 1.7 1.8 1.9 2.0 2.1 2.2 λ
Figure 7.8
3. From the plotted graph, the gradient of the graph, m and Planck’s constant, h are determined.
me
Given h = —— ; e = charge of one electron (1.60 × 10 C) and c = speed of light in vacuum
–19
c
8
(3.00 × 10 m s )
–1
–6
–19
2.50 – 1.38 (1.19 × 10 )(1.60 × 10 )
m = ———————– and h = ———————————–
(2.20 – 1.26)10 6 3.00 × 10 8
= 1.19 × 10 V m = 6.35 × 10 J s
–34
–6
Discussion:
The activation voltage, V can be obtained through V-intercept from the graph of I against V as shown in
a
1
Figure 7.9. The activation voltage, V has a linear relationship with — as shown in Figure 7.10. Gradient of
a λ
1 hc
a graph of V against —, m is equal to the value of ——. Therefore, the value of Planck’s constant can be CHAP
e
a λ
me 7
determined from the expression ——.
c
7.2.1
7.2.1 481