
Page 6 - 1202 Question Bank Mathematics Form 5
P. 6
MUST
KNOW Important Diagrams
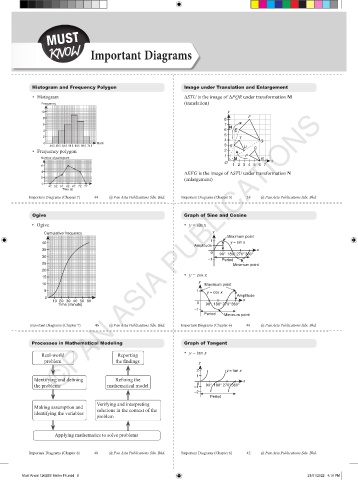
Histogram and Frequency Polygon Image under Translation and Enlargement
• Histogram ∆STU is the image of ∆PQR under transformation M
(translation)
Frequency
10 y
F
8
8
6 7
N
4 6 E
5
2 T
4 G
0 44.5 49.5 54.5 59.5 64.5 69.5 74.5 Mark 3 S U
• Frequency polygon 2 Q
1 P
Number of participant R
M
O x
6 1 2 3 4 5 6 7
∆EFG is the image of ∆STU under transformation N
4
(enlargement)
2
0
47 52 57 62 67 72 77
Time (s)
Important Diagrams (Chapter 7) 44 @ Pan Asia Publications Sdn. Bhd. Important Diagrams (Chapter 5) 38 @ Pan Asia Publications Sdn. Bhd.
Ogive Graph of Sine and Cosine
• Ogive • y = sin x
Cumulative frequency y
Maximum point
1
40 y = sin x
Amplitude
x
35 ©PAN ASIA PUBLICATIONS
0 90° 180° 270°360°
30
–1 Period
25 Minimum point
20
• y = cos x
15
y
10 Maximum point
5 1 y = cos x
Amplitude
0
10 20 30 40 50 60 0 x
Time (minute) 90° 180° 270°360°
–1
Period Minimum point
Important Diagrams (Chapter 7) 46 @ Pan Asia Publications Sdn. Bhd. Important Diagrams (Chapter 6) 40 @ Pan Asia Publications Sdn. Bhd.
Processes in Mathematical Modeling Graph of Tangent
Real-world Reporting • y = tan x
problem the findings y
2 y = tan x
1
Identifying and defining Refining the x
the problems mathematical model –1 0 90° 180° 270°360°
–2
Period
Verifying and interpreting
Making assumption and
identifying the variables solutions in the context of the
problem
Applying mathematics to solve problems
Important Diagrams (Chapter 8) 48 @ Pan Asia Publications Sdn. Bhd. Important Diagrams (Chapter 6) 42 @ Pan Asia Publications Sdn. Bhd.
Must Know 1202BS Maths F5.indd 8 21/01/2022 4:16 PM