Page 65 - Towards_a_New_Malaysia_The_2018_Election_and_Its_6146371_(z-lib.org)
P. 65

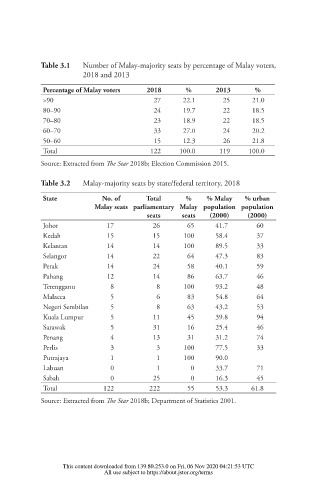
Table 3.1   Number of Malay-majority seats by percentage of Malay voters,
                              2018 and 2013
                   Percentage of Malay voters  2018      %       2013       %
                   >90                           27      22.1       25      21.0
                   80–90                         24      19.7       22      18.5
                   70–80                         23      18.9       22      18.5
                   60–70                         33      27.0       24      20.2
                   50–60                         15      12.3       26      21.8
                   Total                        122     100.0     119     100.0
                  Source: Extracted from  e Star 2018b; Election Commission 2015.

                  Table 3.2   Malay-majority seats by state/federal territory, 2018

                   State           No. of      Total     %     % Malay   % urban
                                 Malay seats parliamentary  Malay  population  population
                                               seats    seats   (2000)    (2000)
                   Johor             17         26        65     41.7        60
                   Kedah             15         15       100     58.4        37
                   Kelantan          14         14       100     89.5        33
                   Selangor          14         22        64     47.3        83
                   Perak             14         24        58     40.1        59
                   Pahang            12         14        86     63.7        46
                   Terengganu         8           8      100     93.2        48
                   Malacca            5           6       83     54.8        64
                   Negeri Sembilan    5           8       63     43.2        53
                   Kuala Lumpur       5          11       45     39.8        94
                   Sarawak            5          31       16     25.4        46
                   Penang             4          13       31     31.2        74
                   Perlis             3           3      100     77.5        33
                   Putrajaya          1           1      100     90.0
                   Labuan             0           1        0     33.7        71
                   Sabah              0          25        0     16.3        45
                   Total           122          222       55     53.3      61.8
                  Source: Extracted from  e Star 2018b; Department of Statistics 2001.


                        This content downloaded from 139.80.253.0 on Fri, 06 Nov 2020 04:21:53 UTC
                                   All use subject to https://about.jstor.org/terms
   60   61   62   63   64   65   66   67   68   69   70