
Page 22 - Georgetown Retail Merchandising Plan 11.7.16 - FINAL
P. 22
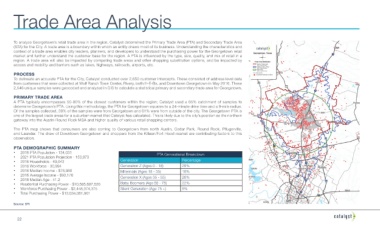
Trade Area Analysis


        To analyze Georgetown’s retail trade area in the region, Catalyst determined the Primary Trade Area (PTA) and Secondary Trade Area
        (STA) for the City. A trade area is a boundary within which an entity draws most of its business. Understanding the characteristics and
        context of a trade area enables city leaders, planners, and developers to understand the purchasing power for the Georgetown retail
        market and further understand the customer base for the region. A PTA is influenced by the type, size, quality, and mix of retail in a   Georgetown, Texas
        region. A trade area will also be impacted by competing trade areas and other shopping substitution options, and be impacted by   Trade Area Distribution
        access and mobility and barriers such as lakes, highways, railroads, airports, etc.                                              Primary Trade Area
                                                                                                                                         (65% Catchment)
                                                                                                                                         24 Minute Drive Time
                                                                                                                                         (65% Catchment)
                                                                                                                                         9 Mile Ring
                                                                                                                                         (63% Catchment)
        PROCESS                                                                                                                          City Limits
                                                                                                                                         Customer Samples (2,546)
        To delineate an accurate PTA for the City, Catalyst conducted over 2,650 customer intercepts. These consisted of address level data
        from customers that were collected at Wolf Ranch Town Center, Rivery, both H-E-Bs, and Downtown Georgetown in May 2016. These
        2,546 unique samples were geocoded and analyzed in GIS to calculate a statistical primary and secondary trade area for Georgetown.
        PRIMARY TRADE AREA
        A PTA typically encompasses 50-80% of the closest customers within the region; Catalyst used a 65% catchment of samples to
        determine Georgetown’s PTA. Using this methodology, the PTA for Georgetown equates to a 24-minute drive time and a 9-mile radius.
        Of the samples collected, 39% of the samples were from Georgetown and 61% were from outside of the city. The Georgetown PTA is
        one of the largest trade areas for a suburban market that Catalyst has calculated. This is likely due to the city’s position as the northern
        gateway into the Austin-Round Rock MSA and higher quality of various retail shopping centers.

        The  PTA  map  shows  that  consumers  are  also  coming  to  Georgetown  from  north  Austin,  Cedar  Park,  Round  Rock,  Pflugerville,
        and Leander. The draw of Downtown Georgetown and shoppers from the Killeen/Fort Hood market are contributing factors to this
        observation.

        PTA DEMOGRAPHIC SUMMARY
        •   2016 PTA Population - 134,031                                           PTA Generational Breakdown
        •   2021 PTA Population Projection - 153,973
        •   2016 Households - 49,043                             Generation                       Percentage
        •   2016 Workforce - 30,994                              Generation Z (Ages 0 - 18)       25%
        •   2016 Median Income - $78,988                         Millennials (Ages 18 - 35)       18%
        •   2016 Average Income - $93,176                        Generation X (Ages 35 - 55)      26%
        •   2016 Median Age - 41.2
        •   Residential Purchasing Power - $10,585,687,526       Baby Boomers (Age 55 - 75)       22%
        •   Workforce Purchasing Power - $2,448,374,375          Silent Generation (Age 75 +)     8%
        •   Total Purchasing Power - $13,034,061,901
                                                                                                                                         0         5
                                                                                                                                             miles
        Source: STI


          22