
Page 17 - PESY Vol 7 No 4
P. 17
PESY: Print ISSN 2231-1394, Online ISSN 2278-795X Vol. 7 No 4
METHODOLOGY
For the purpose of study, four teams from different regions of University Cricket
(Women) players were selected at random. Since the data pertains to the team players, the
numbers of subjects were limited to the team. The players were approached a day prior to the
competition to administer the “Competition Anxiety test”.
The SCAT (according to Martens, 1990) – is an analysis of Competition
anxiety; a test measuring the tendency of an athlete to experience anxiety when competing in
a sport. It is used to measure competitive trait anxiety. Test scoring is based on 10 questions
that ask individuals how they feel when competing in sports and games. Each item is
answered on a three-point scale (often, sometimes, hardly ever) and a summary score ranging
from 10 (low competitive trait anxiety) to 30 (high competitive trait anxiety) is computed for
each respondent. SCAT score is obtained based on the guide for the test.
To examine the hypothesis study, descriptive statistics such as mean, standard
deviation, variation and comparative statistics – one –way ANOVA were used.
The data was analysed using the Microsoft Data Analysis package of Anova-one-way.
DATA COLLECTION – INTER-UNIVERSITY CRICKET (WOMEN)
COMPETITION
Researcher has personally contacted the respective teams chosen as subjects of study.
Sport competition anxiety test (SCAT)questionnaire was used for collection of response of
players.
16 players were chosen at random from each team. A total of 64 players were
administered the SCAT questionnaire. Consent, along with demographic information was
obtained from each subject player before administering the questionnaire.
The players were briefed regarding the purpose of the study and where required
explained the questions where they had doubts due to language. No assistance, however, was
directed towards any specific response. The data was restricted to the players only. The data
was collected separately from the teams ensuring that there was no sharing of response by the
players from different teams.The SCAT questionnaire was administered and the response
obtained from the teams. The data was compiled. Scores were obtained using the reference
keys. The results were used for statistical analysis.
DATA ANALYSIS
The basic statistical parameters of arithmetic mean, standard deviation (SD),
maximum and minimum values and variance were processed. Differences between the groups
for assessing the anxiety levels amongst cricket players was determined using one-way
ANOVA statistics. Using Univariate test (ANOVA) the dependent variable was found to be
significantly different (among the four professional group of players) at 63 degree of
freedom. The data interpretation for the SCAT is appended below for the two groups
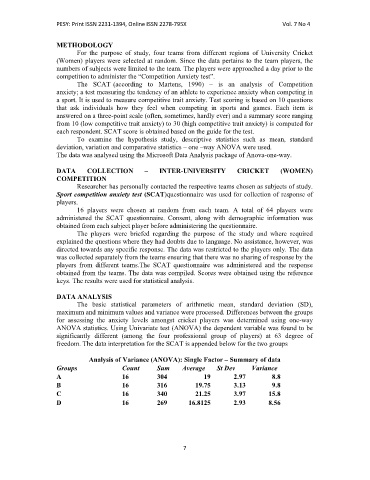
Analysis of Variance (ANOVA): Single Factor – Summary of data
Groups Count Sum Average St Dev Variance
A 16 304 19 2.97 8.8
B 16 316 19.75 3.13 9.8
C 16 340 21.25 3.97 15.8
D 16 269 16.8125 2.93 8.56
7