
Page 18 - PESY Vol 7 No 4
P. 18
PESY: Print ISSN 2231-1394, Online ISSN 2278-795X Vol. 7 No 4
ANOVA
Source of Variation SS df MS F P-value F crit
Between Groups 163.9219 3 54.6406 5.0873 0.0033 2.7581
Within Groups 644.4375 60 10.7406
Total 808.3594 63
SCAT Scores
30
28
26
24
22
20
18
16
14
12
10
1 2 3 4 5 6 7 8 9 10 11 12 13 14 15 16
A B C D
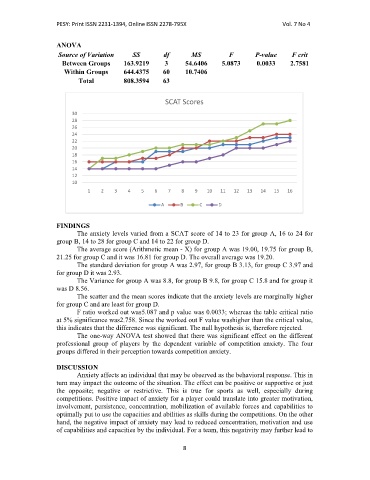
FINDINGS
The anxiety levels varied from a SCAT score of 14 to 23 for group A, 16 to 24 for
group B, 14 to 28 for group C and 14 to 22 for group D.
The average score (Arithmetic mean - X) for group A was 19.00, 19.75 for group B,
21.25 for group C and it was 16.81 for group D. The overall average was 19.20.
The standard deviation for group A was 2.97, for group B 3.13, for group C 3.97 and
for group D it was 2.93.
The Variance for group A was 8.8, for group B 9.8, for group C 15.8 and for group it
was D 8.56.
The scatter and the mean scores indicate that the anxiety levels are marginally higher
for group C and are least for group D.
F ratio worked out was5.087 and p value was 0.0033; whereas the table critical ratio
at 5% significance was2.758. Since the worked out F value washigher than the critical value,
this indicates that the difference was significant. The null hypothesis is, therefore rejected.
The one-way ANOVA test showed that there was significant effect on the different
professional group of players by the dependent variable of competition anxiety. The four
groups differed in their perception towards competition anxiety.
DISCUSSION
Anxiety affects an individual that may be observed as the behavioral response. This in
turn may impact the outcome of the situation. The effect can be positive or supportive or just
the opposite; negative or restrictive. This is true for sports as well, especially during
competitions. Positive impact of anxiety for a player could translate into greater motivation,
involvement, persistence, concentration, mobilization of available forces and capabilities to
optimally put to use the capacities and abilities as skills during the competitions. On the other
hand, the negative impact of anxiety may lead to reduced concentration, motivation and use
of capabilities and capacities by the individual. For a team, this negativity may further lead to
8