
Page 22 - PESY Vol 7 No 4
P. 22
PESY: Print ISSN 2231-1394, Online ISSN 2278-795X Vol. 7 No 4
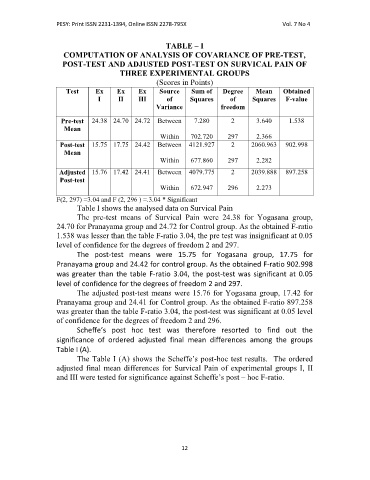
TABLE – I
COMPUTATION OF ANALYSIS OF COVARIANCE OF PRE-TEST,
POST-TEST AND ADJUSTED POST-TEST ON SURVICAL PAIN OF
THREE EXPERIMENTAL GROUPS
(Scores in Points)
Test Ex Ex Ex Source Sum of Degree Mean Obtained
I II III of Squares of Squares F-value
Variance freedom
Pre-test 24.38 24.70 24.72 Between 7.280 2 3.640 1.538
Mean
Within 702.720 297 2.366
Post-test 15.75 17.75 24.42 Between 4121.927 2 2060.963 902.998
Mean
Within 677.860 297 2.282
Adjusted 15.76 17.42 24.41 Between 4079.775 2 2039.888 897.258
Post-test
Within 672.947 296 2.273
F(2, 297) =3.04 and F (2, 296 ) =.3.04 * Significant
Table I shows the analysed data on Survical Pain
The pre-test means of Survical Pain were 24.38 for Yogasana group,
24.70 for Pranayama group and 24.72 for Control group. As the obtained F-ratio
1.538 was lesser than the table F-ratio 3.04, the pre test was insignificant at 0.05
level of confidence for the degrees of freedom 2 and 297.
The post-test means were 15.75 for Yogasana group, 17.75 for
Pranayama group and 24.42 for control group. As the obtained F-ratio 902.998
was greater than the table F-ratio 3.04, the post-test was significant at 0.05
level of confidence for the degrees of freedom 2 and 297.
The adjusted post-test means were 15.76 for Yogasana group, 17.42 for
Pranayama group and 24.41 for Control group. As the obtained F-ratio 897.258
was greater than the table F-ratio 3.04, the post-test was significant at 0.05 level
of confidence for the degrees of freedom 2 and 296.
Scheffe’s post hoc test was therefore resorted to find out the
significance of ordered adjusted final mean differences among the groups
Table I (A).
The Table I (A) shows the Scheffe’s post-hoc test results. The ordered
adjusted final mean differences for Survical Pain of experimental groups I, II
and III were tested for significance against Scheffe’s post – hoc F-ratio.
12