
Page 19 - Vol 7 No 3 July September 2017
P. 19
PESY: Print ISSN 2231-1394, Online ISSN 2278-795X Vol. 7 No 3
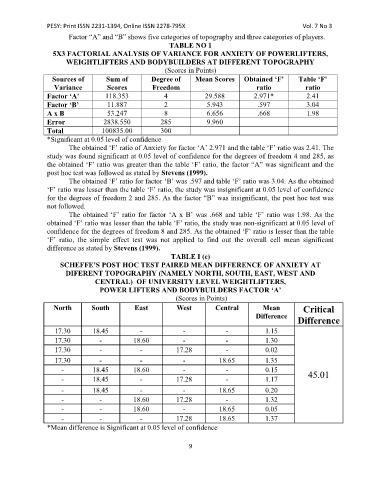
Factor “A” and “B” shows five categories of topography and three categories of players.
TABLE NO 1
5X3 FACTORIAL ANALYSIS OF VARIANCE FOR ANXIETY OF POWERLIFTERS,
WEIGHTLIFTERS AND BODYBUILDERS AT DIFFERENT TOPOGRAPHY
(Scores in Points)
Sources of Sum of Degree of Mean Scores Obtained ‘F’ Table ‘F’
Variance Scores Freedom ratio ratio
Factor ‘A’ 118.353 4 29.588 2.971* 2.41
Factor ‘B’ 11.887 2 5.943 .597 3.04
A x B 53.247 8 6.656 .668 1.98
Error 2838.550 285 9.960
Total 100835.00 300
*Significant at 0.05 level of confidence
The obtained ‘F’ ratio of Anxiety for factor ‘A’ 2.971 and the table ‘F’ ratio was 2.41. The
study was found significant at 0.05 level of confidence for the degrees of freedom 4 and 285, as
the obtained ‘F’ ratio was greater than the table ‘F’ ratio, the factor “A” was significant and the
post hoc test was followed as stated by Stevens (1999).
The obtained ‘F’ ratio for factor ‘B’ was .597 and table ‘F’ ratio was 3.04. As the obtained
‘F’ ratio was lesser than the table ‘F’ ratio, the study was insignificant at 0.05 level of confidence
for the degrees of freedom 2 and 285. As the factor “B” was insignificant, the post hoc test was
not followed.
The obtained ‘F’ ratio for factor ‘A x B’ was .668 and table ‘F’ ratio was 1.98. As the
obtained ‘F’ ratio was lesser than the table ‘F’ ratio, the study was non-significant at 0.05 level of
confidence for the degrees of freedom 8 and 285. As the obtained ‘F’ ratio is lesser than the table
‘F’ ratio, the simple effect test was not applied to find out the overall cell mean significant
difference as stated by Stevens (1999).
TABLE I (c)
SCHEFFE’S POST HOC TEST PAIRED MEAN DIFFERENCE OF ANXIETY AT
DIFERENT TOPOGRAPHY (NAMELY NORTH, SOUTH, EAST, WEST AND
CENTRAL) OF UNIVERSITY LEVEL WEIGHTLIFTERS,
POWER LIFTERS AND BODYBUILDERS FACTOR ‘A’
(Scores in Points)
North South East West Central Mean Critical
Difference
Difference
17.30 18.45 - - - 1.15
17.30 - 18.60 - - 1.30
17.30 - - 17.28 - 0.02
17.30 - - - 18.65 1.35
- 18.45 18.60 - - 0.15 45.01
- 18.45 - 17.28 - 1.17
- 18.45 - - 18.65 0.20
- - 18.60 17.28 - 1.32
- - 18.60 - 18.65 0.05
- - - 17.28 18.65 1.37
*Mean difference is Significant at 0.05 level of confidence
9