
Page 23 - Vol 7 No 3 July September 2017
P. 23
PESY: Print ISSN 2231-1394, Online ISSN 2278-795X Vol. 7 No 3
calisthenics, stretching, sit-ups, pushups and medicine ball exercise with moderate intensity (60-
70%). Mean and standard deviation were calculated for LDL for each group. . ‘t’ test was used to
find out the significance difference between the mean of pre and post test of each group with
respect to Low density lipoprotein. Statistical significance was set to priority at 0.05 levels.
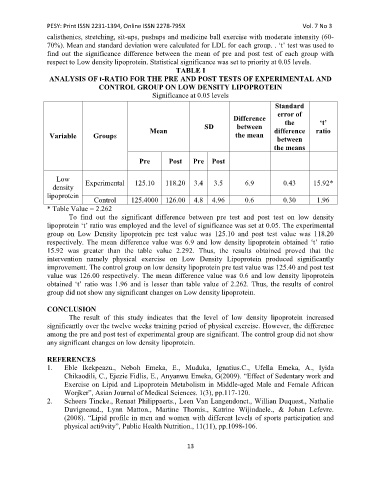
TABLE I
ANALYSIS OF t-RATIO FOR THE PRE AND POST TESTS OF EXPERIMENTAL AND
CONTROL GROUP ON LOW DENSITY LIPOPROTEIN
Significance at 0.05 levels
Standard
error of
Difference
the ‘t’
Mean SD between difference ratio
Variable Groups the mean
between
the means
Pre Post Pre Post
Low
density Experimental 125.10 118.20 3.4 3.5 6.9 0.43 15.92*
lipoprotein
Control 125.4000 126.00 4.8 4.96 0.6 0.30 1.96
* Table Value = 2.262
To find out the significant difference between pre test and post test on low density
lipoprotein ‘t’ ratio was employed and the level of significance was set at 0.05. The experimental
group on Low Density lipoprotein pre test value was 125.10 and post test value was 118.20
respectively. The mean difference value was 6.9 and low density lipoprotein obtained ‘t’ ratio
15.92 was greater than the table value 2.292. Thus, the results obtained proved that the
intervention namely physical exercise on Low Density Lipoprotein produced significantly
improvement. The control group on low density lipoprotein pre test value was 125.40 and post test
value was 126.00 respectively. The mean difference value was 0.6 and low density lipoprotein
obtained ‘t’ ratio was 1.96 and is lesser than table value of 2.262. Thus, the results of control
group did not show any significant changes on Low density lipoprotein.
CONCLUSION
The result of this study indicates that the level of low density lipoprotein increased
significantly over the twelve weeks training period of physical exercise. However, the difference
among the pre and post test of experimental group are significant. The control group did not show
any significant changes on low density lipoprotein.
REFERENCES
1. Eble Ikekpeazu., Neboh Emeka, E., Muduka, Ignatius.C., Ufella Emeka, A., Iyida
Chikaodili, C., Ejezie Fidlis, E., Anyanwu Emeka, G(2009). “Effect of Sedentary work and
Exercise on Lipid and Lipoprotein Metabolism in Middle-aged Male and Female African
Worjker”, Asian Journal of Medical Sciences. 1(3), pp.117-120.
2. Scheers Tincke., Renaat Philippaerts., Leen Van Langendonct., Willian Duquest., Nathalie
Duvigneaud., Lynn Matton., Martine Thomis., Katrine Wijindaele., & Johan Lefevre.
(2008). “Lipid profile in men and women with different levels of sports participation and
physical acti9vity”, Public Health Nutrition., 11(11), pp.1098-106.
13