
Page 20 - Vol 7 No 3 July September 2017
P. 20
PESY: Print ISSN 2231-1394, Online ISSN 2278-795X Vol. 7 No 3
Table II (A) shows the Scheffe’s Post Hoc test for paired mean difference of Achievement
Motivation of different topography namely North, South, East, West and Central (Factor ‘A’). The
mean difference between North and South, North and East, North and West, North and Central,
South and East, South and West, South and Central, East and West, East and Central and West
and Central were 0.23, 1.27,2.87, 1.07, 1.04, 2.64, 0.84,1.6, 0.2 and 1.8. The Scheffe’s Critical
Difference Value was 187.98.
Hence the following comparisons were found not significant:
North and South, north and East, North and West, North and Central, South and East,
South and West, South and Central, East and West, East and Central and West and Central.
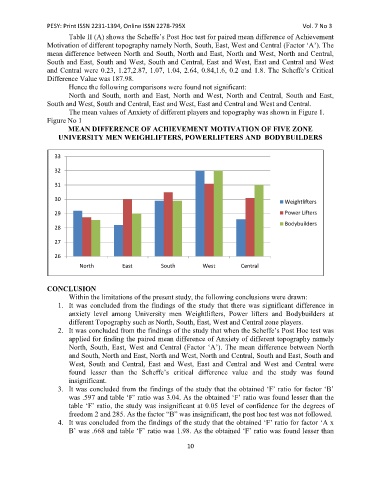
The mean values of Anxiety of different players and topography was shown in Figure 1.
Figure No 1
MEAN DIFFERENCE OF ACHIEVEMENT MOTIVATION OF FIVE ZONE
UNIVERSITY MEN WEIGHLIFTERS, POWERLIFTERS AND BODYBUILDERS
33
32
31
30 Weightlifters
29 Power Lifters
Bodybuilders
28
27
26
North East South West Central
CONCLUSION
Within the limitations of the present study, the following conclusions were drawn:
1. It was concluded from the findings of the study that there was significant difference in
anxiety level among University men Weightlifters, Power lifters and Bodybuilders at
different Topography such as North, South, East, West and Central zone players.
2. It was concluded from the findings of the study that when the Scheffe’s Post Hoc test was
applied for finding the paired mean difference of Anxiety of different topography namely
North, South, East, West and Central (Factor ‘A’). The mean difference between North
and South, North and East, North and West, North and Central, South and East, South and
West, South and Central, East and West, East and Central and West and Central were
found lesser than the Scheffe’s critical difference value and the study was found
insignificant.
3. It was concluded from the findings of the study that the obtained ‘F’ ratio for factor ‘B’
was .597 and table ‘F’ ratio was 3.04. As the obtained ‘F’ ratio was found lesser than the
table ‘F’ ratio, the study was insignificant at 0.05 level of confidence for the degrees of
freedom 2 and 285. As the factor “B” was insignificant, the post hoc test was not followed.
4. It was concluded from the findings of the study that the obtained ‘F’ ratio for factor ‘A x
B’ was .668 and table ‘F’ ratio was 1.98. As the obtained ‘F’ ratio was found lesser than
10