
Page 354 - เอกสารประกอบการประชุมวิชาการ ศูนย์วิจัยพืชไร่ขอนแก่น ประจำปี 2563 เล่มที่ 1
P. 354
349
Table 28 Analysis benefit cost ratio of plant cane ratoon 1 and ratoon 2 under different
managements on Kosum Phisai district Maha Sarakham Province
Sugarcane Yield CCS Total Cost Variable income Benafit BCR
Management Cultivars/clone (ton/rai) (bath/rai) Cost (Bath/rai) (Bath/rai) (%)
27-3-6 + KK07-037, S1 33.38 13.00 26,711 4,365 19,705 8,911 0.74
Filtercake + LK92-11, S2 37.96 15.66 30,946 4,907 22,537 16,119 0.73
Dolomite
(Rainfed),M1 KK 3, S3 37.01 15.49 29,627 4,788 22,557 14,194 0.76
27-3-6 + KK07-037 40.59 13.27 36,478 6,653 27,283 7,231 0.75
Filtercake + LK92-11 37.18 15.67 31,524 6,427 27,524 8,178 0.87
Dolomite (Water
supplement),M2 KK 3 42.9 16.42 36,388 7,052 29,810 12,562 0.82
40.5-3-6 + KK07-037 36.49 12.05 31,915 6,432 26,313 3,024 0.82
Filtercake + LK92-11 39.91 15.61 34,912 6,955 28,169 8,551 0.81
Dolomite (Water KK 3 45.44 15.02 38,795 7,417 30,872 12,300 0.80
supplement),M3
Average M1 36.12 14.72 29,095 4,687 21,600 13,075 0.74
Average M2 40.22 15.12 34,797 6,711 28,206 9,324 0.81
Average M3 40.61 14.23 35,207 6,935 28,451 7,959 0.81
Average S1 36.82 12.77 31,701 5,816 24,433 6,388 0.77
Average S2 38.35 15.65 32,460 6,096 26,076 10,950 0.80
Average S3 41.78 15.64 34,936 6,419 27,746 13,019 0.79
mm
90
80
70
60
50
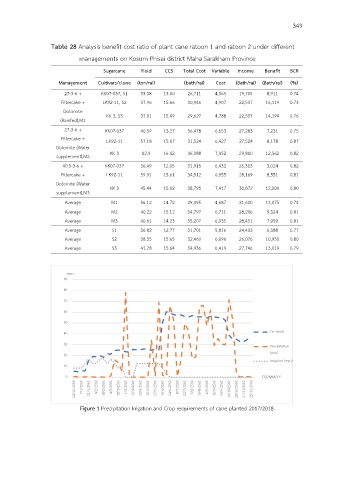
40 Etc (mm)
30 Precipitation
20 (mm)
Irrigation (mm)
10
0 DD/MM/YY
24/12/2559 7/1/2560 21/1/2560 4/2/2560 18/2/2560 4/3/2560 18/3/2560 1/4/2560 15/4/2560 29/4/2560 13/5/2560 27/5/2560 10/6/2560 24/6/2560 8/7/2560 22/7/2560 5/8/2560 19/8/2560 2/9/2560 16/9/2560 30/9/2560 14/10/2560 28/10/2560 11/11/2560 25/11/2560
Figure 1 Precipitation Irrigation and Crop requirements of cane planted 2017/2018