
Page 255 - Math Smart - 7
P. 255
CHAPTER 11.2
In this chapter
Linear Graphs Using Pupils should be able to:
• generate coordinate
pairs that satisfy a linear
Coordinate Pairs equation where, y is
given explicitly in terms
of .V
A function, or an equation, is a written relationship or pattern between two
• plot the corresponding
quantities. Coordinate geometry helps us to display the patterns we observe
graphs
between two quantities visually. A coordinate graph is like a picture of their
• recognise straight-line
relationship. We use coordinate grids to plot the points of an equation to help us
graphs parallel to the
draw the line graphs.
.V- or y-axis
To draw the graph, we plot coordinate points and linear equations (where _v is
given in terms of x) on a set of axes. A linear graph is a straight line.
Example 1
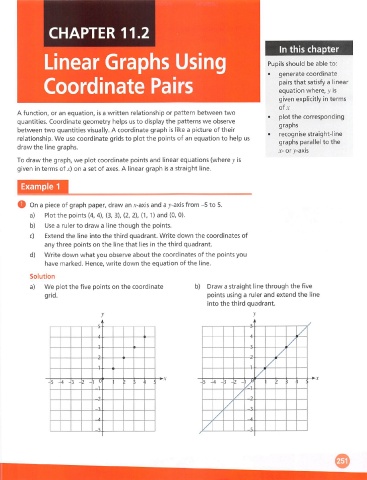
O On a piece of graph paper, draw an x-axis and a y-axis from -5 to 5.
a) Plot the points (4, 4), (3, 3), (2, 2), (1, 1) and (0, 0).
b) Use a ruler to draw a line though the points.
c) Extend the line into the third quadrant. Write down the coordinates of
any three points on the line that lies in the third quadrant.
d) Write down what you observe about the coordinates of the points you
have marked. Hence, write down the equation of the line.
Solution
a) We plot the five points on the coordinate b) Draw a straight line through the five
grid. points using a ruler and extend the line
into the third quadrant.
•>
1
U
5 -4 -3 - 2 - 1 ; 1 5 - 4 - 3 - 2 - 1 M >
n n - -
1 1
/ 7
/
7, .3
/
rA 4
/
-S -S