
Page 259 - Math Smart - 7
P. 259
In this chapter
Pupils should be able to:
• draw and interpret
graphs in real life
contexts involving
more than one stage
Conversion graphs
We can use a conversion graph to show the relationship between two units of
measurement. It can be used to help us convert from one unit to another.
Example 1
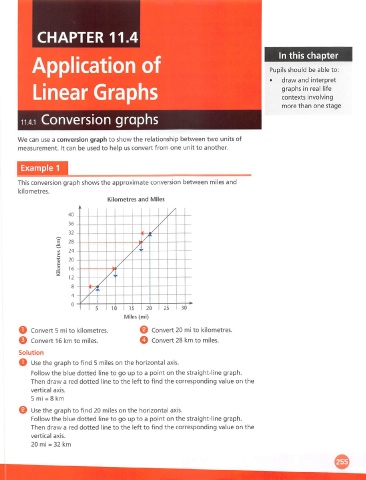
This conversion graph shows the approximate conversion between miles and
kilometres.
Kilometres and Miles
1 k
/]
40
/
36
/
32
b. ?R
1/> 74
/
a> 20
F /
o 16
/
12
/
4
/
0
t
1 ) 1 ! 2) 2 I 3)
Miles (ml)
O Convert 5 mi to kilometres. O Convert 20 mi to kilometres,
O Convert 16 km to miles. o Convert 28 km to miles.
Solution
o Use the graph to find 5 miles on the horizontal axis.
Follow the blue dotted line to go up to a point on the straight-line graph.
Then draw a red dotted line to the left to find the corresponding value on the
vertical axis.
5 mi = 8 km
@ Use the graph to find 20 miles on the horizontal axis.
Follow the blue dotted line to go up to a point on the straight-line graph.
Then draw a red dotted line to the left to find the corresponding value on the
vertical axis.
20 mi = 32 km