
Page 260 - Math Smart - 7
P. 260
O Use the graph to find 16 km on the vertical axis.
Follow the red dotted line to the right to go to the straight-line graph.
Then draw a blue dotted line to go down to find the corresponding value on
the horizontal axis.
16 km = 10 mi.
O Use the graph to find 28 km on the vertical axis.
Follow the red dotted line to the right to go to the straight-line graph.
Then draw a blue dotted line to go down to find the corresponding value on
the horizontal axis.
28 km = 17.5 mi.
.4.2 Wages chart
Straight line graphs are useful to track one quantity against another quantity that
changes proportionally to each other.
Example 2
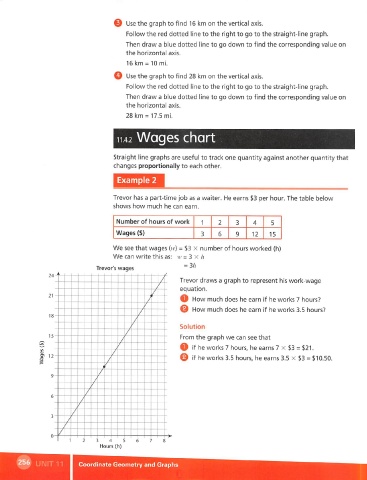
Trevor has a part-time job as a waiter. He earns $3 per hour. The table below
shows how much he can earn.
Number of hours of work 1 2 3 4 5
Wages {$) 3 6 9 12 15
We see that wages (w) = $3 x number of hours worked (h)
We can write this as: u- = 3 x h
= 3/7
Trevor's wages
24
Trevor draws a graph to represent his work-wage
equation.
21
O How much does he earn if he works 7 hours?
@ How much does he earn if he works 3.5 hours?
0
18
0
Solution
0
15 From the graph we can see that
/
if
O he works 7 hours, he earns 7 x $3 = $21.
a>
I 12- / © if he works 3.5 hours, he earns 3.5 x $3 = $10.50.
0
0
0
3
Hours (h)
Coordinate Geometry and Graphs