
Page 698 - Elementary_Linear_Algebra_with_Applications_Anton__9_edition
P. 698
Find the least squares straight line fit to the four points (0, 1), (2, 0), (3, 1), and (3, 2).
2.
Find the quadratic polynomial that best fits the four points (2, 0), (3, −10), (5, −48), and (6, −76).
3.
Find the cubic polynomial that best fits the five points (−1, −14), (0, −5), (1, −4), (2, 1), and (3, 22).
4.
Show that the matrix M in Equation 2 has linearly independent columns if and only if at least two of the numbers , ,
5. … , are distinct.
Show that the columns of the matrix M in Equation 10 are linearly independent if and at least of
6. the numbers , , …, are distinct.
Hint A nonzero polynomial of degree m has at most m distinct roots.
Let M be the matrix in Equation 10. Using Exercise 6, show that a sufficient condition for the matrix to be
7. invertible is that and that at least of the numbers , , …, are distinct.
The owner of a rapidly expanding business finds that for the first five months of the year the sales (in thousands) are $4.0,
8. $4.4, $5.2, $6.4, and $8.0. The owner plots these figures on a graph and conjectures that for the rest of the year, the sales
curve can be approximated by a quadratic polynomial. Find the least squares quadratic polynomial fit to the sales curve,
and use it to project the sales for the twelfth month of the year.
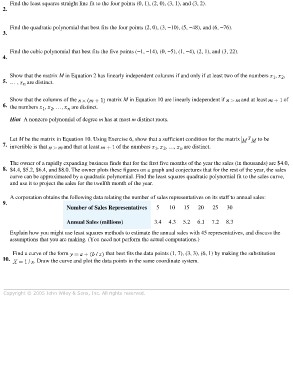
A corporation obtains the following data relating the number of sales representatives on its staff to annual sales:
9.
Number of Sales Representatives 5 10 15 20 25 30
Annual Sales (millions) 3.4 4.3 5.2 6.1 7.2 8.3
Explain how you might use least squares methods to estimate the annual sales with 45 representatives, and discuss the
assumptions that you are making. (You need not perform the actual computations.)
Find a curve of the form that best fits the data points (1, 7), (3, 3), (6, 1) by making the substitution
10. . Draw the curve and plot the data points in the same coordinate system.
Copyright © 2005 John Wiley & Sons, Inc. All rights reserved.