Page 140 - Fisika Terapan for Engineers and Scientists
P. 140

340                                CHAPTER 11  Collisions


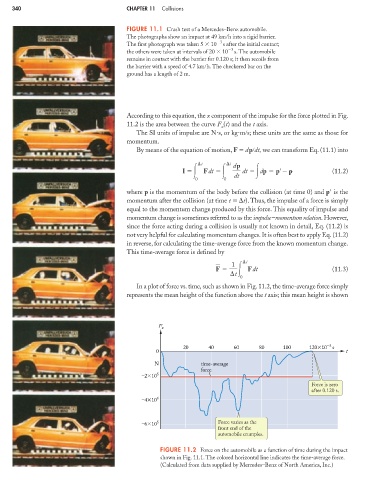
                                                   FIGURE 11.1 Crash test of a Mercedes–Benz automobile.
                                                   The photographs show an impact at 49 km h into a rigid barrier.
                                                   The first photograph was taken 5   10  3  s after the initial contact;
                                                   the others were taken at intervals of 20   10  3  s. The automobile
                                                   remains in contact with the barrier for 0.120 s; it then recoils from
                                                   the barrier with a speed of 4.7 km h. The checkered bar on the
                                                   ground has a length of 2 m.


                                                   According to this equation, the x component of the impulse for the force plotted in Fig.
                                                   11.2 is the area between the curve F (t) and the t axis.
                                                                               x
                                                      The SI units of impulse are N s, or kg m s; these units are the same as those for
                                                   momentum.
                                                      By means of the equation of motion, F   dp dt, we can transform Eq. (11.1) into

                                                                         ¢t       ¢t  dp
                                                                    I     F dt        dt   dp   p   p            (11.2)
                                                                        0       0  dt
                                                   where p is the momentum of the body before the collision (at time 0) and p  is the
                                                   momentum after the collision (at time t   t). Thus, the impulse of a force is simply
                                                   equal to the momentum change produced by this force. This equality of impulse and
                                                   momentum change is sometimes referred to as the impulse–momentum relation.However,
                                                   since the force acting during a collision is usually not known in detail, Eq. (11.2) is
                                                   not very helpful for calculating momentum changes. It is often best to apply Eq. (11.2)
                                                   in reverse, for calculating the time-average force from the known momentum change.
                                                   This time-average force is defined by
                                                                                   1  ¢t
                                                                              F         F dt                     (11.3)
                                                                                  ¢t
                                                                                     0
                                                      In a plot of force vs. time, such as shown in Fig. 11.2, the time-average force simply
                                                   represents the mean height of the function above the t axis; this mean height is shown


                                                            F x


                                                                    20      40     60      80     100     120 10 –3  s
                                                            0                                                        t
                                                           N             time-average
                                                                            -
                                                                         force e
                                                       –2 10 5
                                                                                                           Force is zero
                                                                                                           after 0.120 s.
                                                       –4 10 5


                                                       –6 10 5                 Force varies as the
                                                                               front end of the
                                                                               automobile crumples.

                                                             FIGURE 11.2 Force on the automobile as a function of time during the impact
                                                             shown in Fig. 11.1. The colored horizontal line indicates the time-average force.
                                                             (Calculated from data supplied by Mercedes–Benz of North America, Inc.)
   135   136   137   138   139   140   141   142   143   144   145