
Page 141 - fbkCardioDiabetes_2017
P. 141
Regression of Atherosclerosis- In Diabetics 117
accurate measurement of fibrous cap thickness and
tissue composition, and also for detection of macro-
phages that appear as signal-rich bands with a sharp
shadow [8].
NIRS: This imaging technique shows a high correla-
tion with histopathology for lipid detection with a
sensitivity and specificity of 90% [9]. “Chemogram”
derived from NIRS provides compositional and no
structural information. It also provides automated
lipid-core detection, thereby facilitating its real-time
use for detection of lipid-rich lesions during cardiac
catheterization. Overall, these modalities each fea-
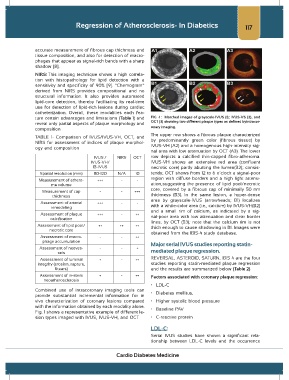
ture certain advantages and limitations (Table 1) and FIG -1 : Matched images of grayscale-IVUS (1); IVUS-VS (2), and
reveal only partial aspects of plaque morphology and OCT (3) showing two different plaque types as defined byintracor-
composition onary imaging.
The upper row shows a fibrous plaque characterized
TABLE 1- Comparison of IVUS/IVUS-VH, OCT, and by predominantly green color (fibrous tissue) by
NIRS for assessment of indices of plaque morphol- IVUS-VH (A2) and a homogenous high-intensity sig-
ogy and composition
nal area with low attenuation by OCT (A3). The lower
IVUS / NIRS OCT row depicts a calcified thin-capped fibro-atheroma.
IVUS-VH/ IVUS-VH shows an extensive red area (confluent
IB-IVUS necrotic core) partly abutting the lumen(B2); consis-
Spatial resolution (mm) 80-120 N/A 10 tently, OCT shows from 12 to 6 o’clock a signal-poor
region with diffuse borders and a high light attenu-
Measurement of athero- +++ - -
ma volume ation,suggesting the presence of lipid pool/necrotic
core, covered by a fibrous cap of minimally 50 nm
Measurement of cap - - +++
thickness thickness (B3). In the same lesion, a hyper-dense
area by grayscale-IVUS (arrowheads; B1) localizes
Assessment of arterial +++ - - with a white-color area (i.e., calcium) by IVUS-VH(B2)
remodeling
and a small rim of calcium, as indicated by a sig-
Assessment of plaque +++ - ++ nal-poor area with low attenuation and clear border
calcification
lines, by OCT (B3); note that the calcium rim is not
Assessment of lipid pool/ ++ ++ ++ thick enough to cause shadowing in B1. Images were
necrotic core
obtained from the IBIS-4 study database.
Assessment of macro- - - ++
phage accumulation Major serial IVUS studies reporting statin-
Assessment of neoves- - - +
sels mediated plaque regression.
Assessment of luminal + - ++ REVERSAL, ASTEROID, SATURN, IBIS 4 are the four
integrity (erosion, rupture, studies reporting statin-mediated plaque regression
&tears) and the results are summarized below (Table 2)
Assessment of in-stent + - ++ Factors associated with coronary plaque regression:
neoatherosclerosis
• LDL-C
Combined use of intracoronary imaging tools can • Diabetes mellitus,
provide substantial incremental information for in
vivo characterization of coronary lesions compared • Higher systolic blood pressure
with the information obtained by each modality alone. • Baseline PAV
Fig. 1 shows a representative example of different le-
sion types imaged with IVUS, IVUS-VH, and OCT • C-reactive protein
LDL-C:
Serial IVUS studies have shown a significant rela-
tionship between LDL-C levels and the occurrence
Cardio Diabetes Medicine