
Page 143 - fbkCardioDiabetes_2017
P. 143
Regression of Atherosclerosis- In Diabetics 119
change of plaque burden (progression or regression)
on outcomes could not be assessed in the absence
of serial intravascular imaging.
In SATURN, each standard deviation increase of
baseline PAV was associated with a 28% increase in
major adverse cardiovascular events—despite the fact
that LDL-C levels did not differ between patients with
lower vs. higher baseline PAV.(14)
Von Birgelen et al. [15] reported in an observation-
al study that plaque progression detected by IVUS
was associated with more frequent adverse clinical
events.
In the CAMELOT study, the reduced event rate in pa-
tients treated with amlodipine vs. enalapril or placebo
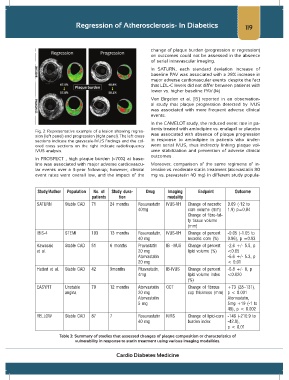
Fig. 2: Representative example of a lesion showing regres-
sion (left panel) and progression (right panel). The left cross was associated with absence of plaque progression
sections indicate the grayscale-IVUS findings and the col- in response to amlodipine in patients who under-
ored cross sections on the right indicate radiofrequency went serial IVUS, thus indirectly linking plaque vol-
IVUS analysis. ume stabilization and prevention of adverse clinical
outcomes .
In PROSPECT , high plaque burden (>70%) at base-
line was associated with major adverse cardiovascu- Moreover, comparison of the same regimens of in-
lar events over a 3-year follow-up; however, clinical tensive vs. moderate statin treatment (atorvastatin 80
event rates were overall low, and the impact of the mg vs. pravastatin 40 mg) in different study popula-
Study/Author Population No. of Study dura- Drug Imaging Endpoint Outcome
patients tion modality
SATURN Stable CAD 71 24 months Rosuvastatin IVUS-VH Change of necrotic 0.09 (-12 to
40mg core volume (mm) 1.9) p=0.84
Change of fibro-fat-
ty tissue volume
(mm)
IBIS-4 STEMI 103 13 months Rosuvastatin, IVUS-VH Change of percent -0.05 (-1.05 to
40 mg necrotic core (%) 0.96), p =0.93
Kawasaki Stable CAD 51 6 months Pravastatin IB -IVUS Change of percent -2.6 +/- 5.5, p
et al. 20 mg lipid volume (%) <0.05
Atorvastatin -6.6 +/- 5.3, p
20 mg < 0.01
Hattori et al. Stable CAD 42 9months Pitavastatin, IB-IVUS Change of percent -6.8 +/- 8, p
4mg lipid volume index <0.020
(%)
EASYFIT Unstable 70 12 months Atorvastatin OCT Change of fibrous +73 (28–131),
angina 20 mg cap thickness (mm) p < 0.001
Atorvastatin Atorvastatin,
5 mg 5mg +19 (-1 to
48), p < 0.002
YELLOW Stable CAD 87 7 Rosuvastatin NIRS Change of lipid-core -146 (-210.9 to
40 mg burden index -42.9),
p < 0.01
Table 3: Summary of studies that assessed changes of plaque composition or characteristics of
vulnerability in response to statin treatment using various imaging modalities.
Cardio Diabetes Medicine