
Page 582 - fbkCardioDiabetes_2017
P. 582
558 Cardio Diabetes Medicine 2017
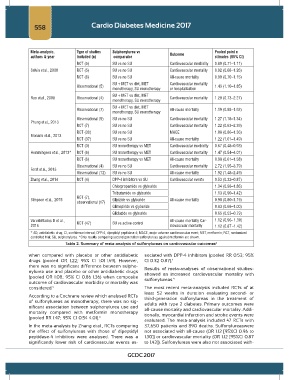
Meta-analysis, Type of studies Sulphonylurea vs Pooled point e
authors & year included (n) comparator Outcome stimates (95% CI)
RCT (5) SU vs no SU Cardiovascular morbidity 0.89 (0.71–1.11)
Selvin et al., 2008 RCT (5) SU vs no SU Cardiovascular mortality 0.92 (0.68–1.26)
RCT (6) SU vs no SU All-cause mortality 0.90 (0.70–1.15)
SU + MET vs diet, MET Cardiovascular mortality
Observational (5) 1.43 (1.10–1.85)
monotherapy, SU monotherapy or hospitalization
SU + MET vs diet, MET
Rao et al., 2008 Observational (4) Cardiovascular mortality 1.29 (0.73–2.27)
monotherapy, SU monotherapy
SU + MET vs diet, MET
Observational (7) All-cause mortality 1.19 (0.88–1.62)
monotherapy, SU monotherapy
Observational (9) SU vs no SU Cardiovascular mortality 1.27 (1.18–1.34)
Phung et al., 2013
RCT (7) SU vs no SU Cardiovascular mortality 1.22 (0.63–2.39)
RCT (30) SU vs no SU MACE 1.08 (0.86–1.36)
Monami et al., 2013
RCT (37) SU vs no SU All-cause mortality 1.22 (1.01–1.49)
RCT (3) SU monotherapy vs MET Cardiovascular morbidity 0.67 (0.48–0.93)
Hemmingsen et al., 2013* RCT (6) SU monotherapy vs MET Cardiovascular mortality 1.47 (0.54–4.01)
RCT (6) SU monotherapy vs MET All-cause mortality 0.98 (0.61–1.58)
Observational (4) SU vs no SU Cardiovascular mortality 2.72 (1.95–3.79)
Forst et al., 2013
Observational (12) SU vs no SU All-cause mortality 1.92 (1.48–2.49)
Zhang et al., 2014 RCT (4) DPP-4 inhibitors vs SU Cardiovascular events 0.53 (0.32–0.87)
Chlorpropamide vs glyburide 1.34 (0.98–1.86)
Tolbutamide vs glyburide 1.13 (0.90–1.42)
RCT (7),
Simpson et al., 2015 Glipizide vs glyburide All-cause mortality 0.98 (0.80–1.19)
observational (17)
Glimepiride vs glyburide 0.83 (0.68–1.00)
Gliclazide vs glyburide 0.65 (0.53–0.79)
VarvakiRados D et al., RCT (47) SU vs active control All-cause mortality Car- 1.12 (0.96- 1.30)
2016 diovascular mortality 1.12 (0.87 -1.42)
* AD, antidiabetic drug; CI, confidence interval; DPP-4, dipeptidyl peptidase-4; MACE, major adverse cardiovascular event; MET, metformin; RCT, randomized
controlled trial; SU, sulphonylurea. *Only results comparing second generation sulfonylureas against metformin are shown.
Table 2. Summary of meta-analysis of sulfonylureas on cardiovascular outcomes 4
when compared with placebo or other antidiabetic sociated with DPP-4 inhibitors (pooled RR 0.53; 95%
drugs (pooled OR 1.22; 95% CI 1.01–1.49). However, CI 0.32–0.87). 4
there was no significant difference between sulpho- Results of meta-analyses of observational studies-
nylurea use and placebo or other antidiabetic drugs showed an increased cardiovascular mortality with
(pooled OR 1.08; 95% CI 0.86–1.36) when composite sulfonylureas. 4
outcome of cardiovascular morbidity or mortality was
considered. 4 The most recent meta-analysis included RCTs of at
least 52 weeks in duration evaluating second- or
According to a Cochrane review which analysed RCTs third-generation sulfonylureas in the treatment of
of sulfonylureas as monotherapy, there was no sig- adults with type 2 diabetes. Primary outcomes were
nificant association between sulphonylurea use and all-cause mortality and cardiovascular mortality. Addi-
mortality compared with metformin monotherapy tionally, myocardial infarction and stroke events were
(pooled RR 1.47; 95% CI 0.54–4.01). 4
evaluated. The meta-analysis included 47 RCTs with
In the meta-analysis by Zhang et al., RCTs comparing 37,650 patients and 890 deaths. Sulfonylureaswere
the effect of sulfonylureas with those of dipeptidyl not associated with all-cause (OR 1.12 [95%CI 0.96 to
peptidase-4 inhibitors were analysed. There was a 1.30]) or cardiovascular mortality (OR 1.12 [95%CI 0.87
significantly lower risk of cardiovascular events as- to 1.42]). Sulfonylureas were also not associated with-
GCDC 2017