
Page 123 - 2018 Comprehensive Annual Financial Report - City of Winston-Salem
P. 123
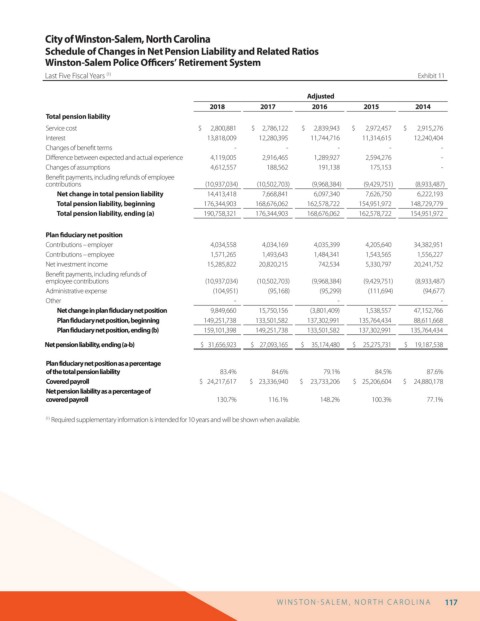
City of Winston-Salem, North Carolina
                  Schedule of Changes in Net Pension Liability and Related Ratios
                  Winston-Salem Police O cers’ Retirement System

                  Last Five Fiscal Years  (1)                                                                    Exhibit 11

                                                                                     Adjusted
                                                            2018         2017         2016          2015         2014
                  Total pension liability
                  Service cost                           $      2,800,881  $     2,786,122  $      2,839,943  $       2,972,457  $       2,915,276
                  Interest                                  13,818,009   12,280,395   11,744,716   11,314,615   12,240,404
                  Changes of bene t terms                         -             -            -            -            -
                  Di erence between expected and actual experience  4,119,005  2,916,465  1,289,927  2,594,276         -
                  Changes of assumptions                    4,612,557      188,562      191,138      175,153           -
                  Bene t payments, including refunds of employee
                  contributions                            (10,937,034)  (10,502,703)  (9,968,384)  (9,429,751)  (8,933,487)
                       Net change in total pension liability  14,413,418  7,668,841    6,097,340    7,626,750    6,222,193
                       Total pension liability, beginning  176,344,903  168,676,062  162,578,722  154,951,972  148,729,779
                       Total pension liability, ending (a)  190,758,321  176,344,903  168,676,062  162,578,722  154,951,972

                  Plan  duciary net position
                  Contributions – employer                  4,034,558     4,034,169    4,035,399    4,205,640   34,382,951
                  Contributions – employee                  1,571,265     1,493,643    1,484,341    1,543,565    1,556,227
                  Net investment income                    15,285,822    20,820,215     742,534     5,330,797   20,241,752
                  Bene t payments, including refunds of
                  employee contributions                   (10,937,034)  (10,502,703)  (9,968,384)  (9,429,751)  (8,933,487)
                  Administrative expense                     (104,951)     (95,168)     (95,299)     (111,694)     (94,677)
                  Other                                           -                          -                         -
                       Net change in plan fiduciary net position  9,849,660  15,750,156  (3,801,409)  1,538,557  47,152,766
                       Plan fiduciary net position, beginning  149,251,738  133,501,582  137,302,991  135,764,434  88,611,668
                       Plan fiduciary net position, ending (b)  159,101,398  149,251,738  133,501,582  137,302,991  135,764,434
                  Net pension liability, ending (a-b)     $   31,656,923  $    27,093,165  $     35,174,480  $     25,275,731  $     19,187,538

                  Plan fiduciary net position as a percentage
                  of the total pension liability               83.4%        84.6%        79.1%        84.5%         87.6%
                  Covered payroll                         $   24,217,617  $    23,336,940  $     23,733,206  $    25,206,604  $     24,880,178
                  Net pension liability as a percentage of
                  covered payroll                             130.7%       116.1%       148.2%        100.3%        77.1%


                  (1)   Required supplementary information is intended for 10 years and will be shown when available.


                                                                             W I N S T O N   S AL E M ,  N O R T H  C AR O L I N A  117