
Page 160 - 2018 Comprehensive Annual Financial Report - City of Winston-Salem
P. 160
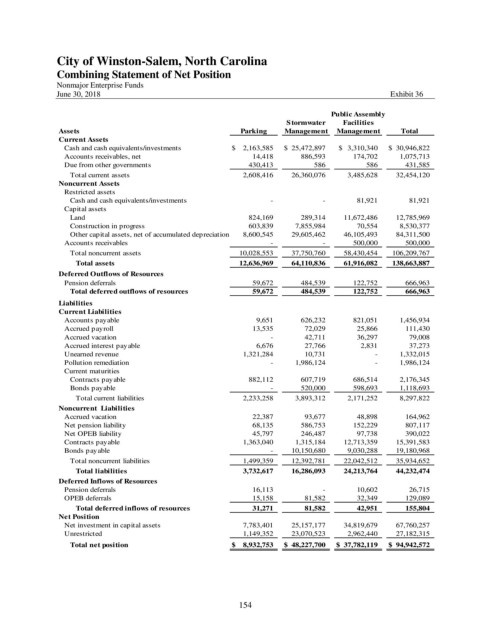
City of Winston-Salem, North Carolina
               Combining Statement of Net Position

               Nonmajor Enterprise Funds
               June 30, 2018                                                                         Exhibit 36

                                                                                     Public Assembly
                                                                          Stormwater     Facilities
                Assets                                        Parking     Management   Management      Total
                Current Assets
                 Cash and cash equivalents/investments      $      2,163,585  $    25,472,897  $    3,310,340  $    30,946,822
                 Accounts receivables, net                              14,418           886,593             174,702        1,075,713
                 Due from other governments                           430,413                  586                    586           431,585
                   Total current assets                            2,608,416      26,360,076          3,485,628      32,454,120
                Noncurrent Assets
                 Restricted assets
                   Cash and cash equivalents/investments                          -                       -             81,921  81,921
                 Capital assets
                   Land                                               824,169           289,314      11,672,486  12,785,969
                   Construction in progress                           603,839        7,855,984             70,554        8,530,377
                   Other capital assets, net of accumulated depreciation       8,600,545      29,605,462      46,105,493      84,311,500
                 Accounts receivables                                             -                       -           500,000           500,000
                   Total noncurrent assets                       10,028,553      37,750,760      58,430,454  106,209,767
                    Total assets                              12,636,969   64,110,836    61,916,082  138,663,887
                Deferred Outflows of Resources
                 Pension deferrals                                      59,672           484,539           122,752           666,963
                   Total deferred outflows of resources          59,672       484,539      122,752      666,963
                Liabilities
                Current Liabilities
                 Accounts payable                                         9,651           626,232           821,051  1,456,934
                 Accrued payroll                                        13,535             72,029             25,866           111,430
                 Accrued vacation                                                 -             42,711             36,297             79,008
                 Accrued interest payable                                 6,676             27,766               2,831             37,273
                 Unearned revenue                                  1,321,284             10,731                       -        1,332,015
                 Pollution remediation                                            -        1,986,124                       -        1,986,124
                 Current maturities
                   Contracts payable                                  882,112           607,719           686,514        2,176,345
                   Bonds payable                                                  -           520,000           598,693        1,118,693
                    Total current liabilities                      2,233,258        3,893,312        2,171,252        8,297,822
                Noncurrent  Liabilities
                 Accrued vacation                                       22,387             93,677             48,898  164,962
                 Net pension liability                                  68,135           586,753           152,229           807,117
                 Net OPEB liability                                     45,797           246,487             97,738           390,022
                 Contracts payable                                 1,363,040        1,315,184      12,713,359      15,391,583
                 Bonds payable                                                    -      10,150,680        9,030,288      19,180,968
                   Total noncurrent liabilities                    1,499,359      12,392,781      22,042,512      35,934,652
                    Total liabilities                              3,732,617      16,286,093      24,213,764      44,232,474
                Deferred Inflows of Resources
                 Pension deferrals                                      16,113                       -             10,602             26,715
                 OPEB deferrals                                         15,158             81,582             32,349           129,089
                    Total deferred inflows of resources                 31,271             81,582             42,951           155,804
                Net Position
                 Net investment in capital assets                  7,783,401      25,157,177      34,819,679  67,760,257
                 Unrestricted                                      1,149,352      23,070,523        2,962,440  27,182,315
                   Total net position                       $      8,932,753  $    48,227,700  $    37,782,119  $    94,942,572


                                                              154