
Page 163 - 2018 Comprehensive Annual Financial Report - City of Winston-Salem
P. 163
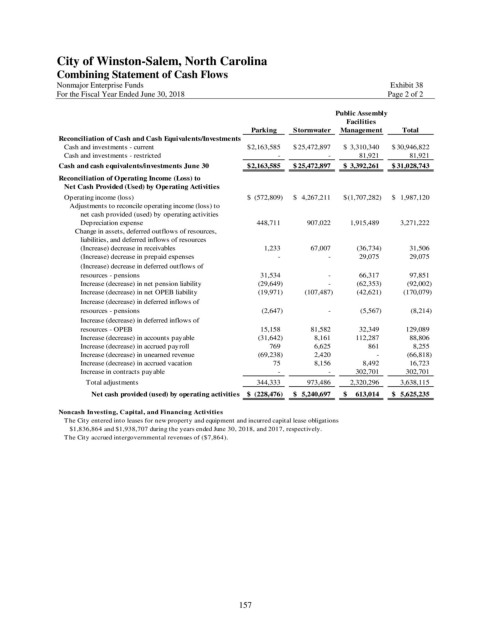
City of Winston-Salem, North Carolina
               Combining Statement of Cash Flows

               Nonmajor Enterprise Funds                                                             Exhibit 38
               For the Fiscal Year Ended June 30, 2018                                              Page 2 of 2

                                                                                       Public Assembly
                                                                                         Facilities
                                                                 Parking    Stormwater  Management      Total
                Reconciliation of Cash and Cash Equivalents/Investments
                 Cash and investments - current                 $  2,163,585  $  25,472,897  $   3,310,340  $  30,946,822
                 Cash and investments - restricted                                 -                       -            81,921             81,921
                Cash and cash equivalents/investments June 30   $  2,163,585  $  25,472,897  $   3,392,261  $  31,028,743
                Reconciliation of Operating Income (Loss) to
                 Net Cash Provided (Used) by Operating Activities
                 Operating income (loss)                        $    (572,809)  $    4,267,211  $  (1,707,282)  $    1,987,120
                   Adjustments to reconcile operating income (loss) to
                     net cash provided (used) by operating activities
                     Depreciation expense                              448,711           907,022       1,915,489        3,271,222
                    Change in assets, deferred outflows of resources,
                     liabilities, and deferred inflows of resources
                     (Increase) decrease in receivables                    1,233             67,007           (36,734)             31,506
                     (Increase) decrease in prepaid expenses                       -                       -            29,075             29,075
                     (Increase) decrease in deferred outflows of
                     resources - pensions                                31,534                       -            66,317             97,851
                     Increase (decrease) in net pension liability          (29,649)                       -           (62,353)            (92,002)
                     Increase (decrease) in net OPEB liability          (19,971)          (107,487)           (42,621)          (170,079)
                     Increase (decrease) in deferred inflows of
                     resources - pensions                                 (2,647)                       -             (5,567)              (8,214)
                     Increase (decrease) in deferred inflows of
                     resources - OPEB                                    15,158             81,582            32,349           129,089
                     Increase (decrease) in accounts payable            (31,642)               8,161          112,287             88,806
                     Increase (decrease) in accrued payroll                   769               6,625                 861               8,255
                     Increase (decrease) in unearned revenue            (69,238)               2,420                      -            (66,818)
                     Increase (decrease) in accrued vacation                    75               8,156              8,492             16,723
                     Increase in contracts payable                                 -                       -          302,701           302,701
                       Total adjustments                               344,333           973,486       2,320,296        3,638,115
                        Net cash provided (used) by operating activities  $    (228,476)  $    5,240,697  $      613,014  $    5,625,235

                Noncash Investing, Capital, and Financing Activities
                 The City entered into leases for new property and equipment and incurred capital lease obligations
                   $1,836,864 and $1,938,707 during the years ended June 30, 2018, and 2017, respectively.
                 The City accrued intergovernmental revenues of ($7,864).


                                                              157