Page 162 - 2018 Comprehensive Annual Financial Report - City of Winston-Salem
P. 162

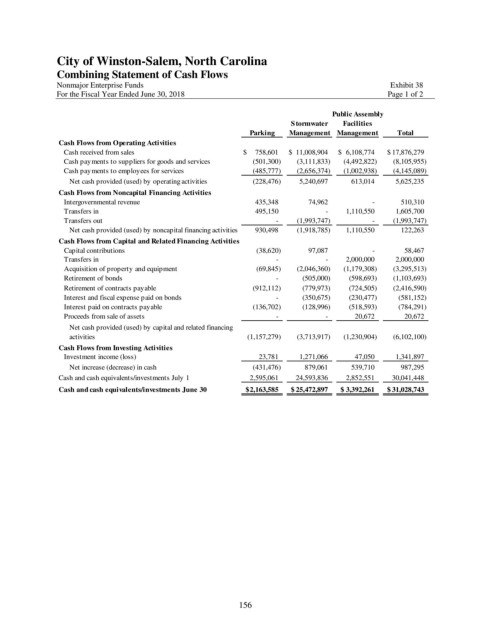
City of Winston-Salem, North Carolina
               Combining Statement of Cash Flows

               Nonmajor Enterprise Funds                                                             Exhibit 38
               For the Fiscal Year Ended June 30, 2018                                              Page 1 of 2

                                                                                      Public Assembly
                                                                           Stormwater   Facilities
                                                                 Parking   Management Management      Total
                Cash Flows from Operating Activities
                 Cash received from sales                      $      758,601  $    11,008,904  $    6,108,774  $  17,876,279
                 Cash payments to suppliers for goods and services        (501,300)       (3,111,833)     (4,492,822)       (8,105,955)
                 Cash payments to employees for services              (485,777)       (2,656,374)     (1,002,938)       (4,145,089)
                   Net cash provided (used) by operating activities        (228,476)        5,240,697          613,014        5,625,235
                Cash Flows from Noncapital Financing Activities
                 Intergovernmental revenue                             435,348             74,962                     -           510,310
                 Transfers in                                          495,150                       -       1,110,550        1,605,700
                 Transfers out                                                     -       (1,993,747)                     -       (1,993,747)
                   Net cash provided (used) by noncapital financing activities         930,498       (1,918,785)       1,110,550           122,263
                Cash Flows from Capital and Related Financing Activities
                 Capital contributions                                  (38,620)             97,087                     -             58,467
                 Transfers in                                                      -                       -       2,000,000        2,000,000
                 Acquisition of property and equipment                  (69,845)       (2,046,360)     (1,179,308)       (3,295,513)
                 Retirement of bonds                                               -          (505,000)        (598,693)       (1,103,693)
                 Retirement of contracts payable                      (912,112)          (779,973)        (724,505)       (2,416,590)
                 Interest and fiscal expense paid on bonds                         -          (350,675)        (230,477)          (581,152)
                 Interest paid on contracts payable                   (136,702)          (128,996)        (518,593)          (784,291)
                 Proceeds from sale of assets                                      -                       -            20,672             20,672
                   Net cash provided (used) by capital and related financing
                   activities                                      (1,157,279)       (3,713,917)     (1,230,904)       (6,102,100)
                Cash Flows from Investing Activities
                 Investment income (loss)                                23,781        1,271,066            47,050        1,341,897
                   Net increase (decrease) in cash                    (431,476)           879,061            539,710           987,295
                Cash and cash equivalents/investments July 1        2,595,061      24,593,836       2,852,551      30,041,448
                Cash and cash equivalents/investments June 30   $  2,163,585  $  25,472,897  $   3,392,261  $  31,028,743


                                                              156
   157   158   159   160   161   162   163   164   165   166   167