
Page 161 - 2018 Comprehensive Annual Financial Report - City of Winston-Salem
P. 161
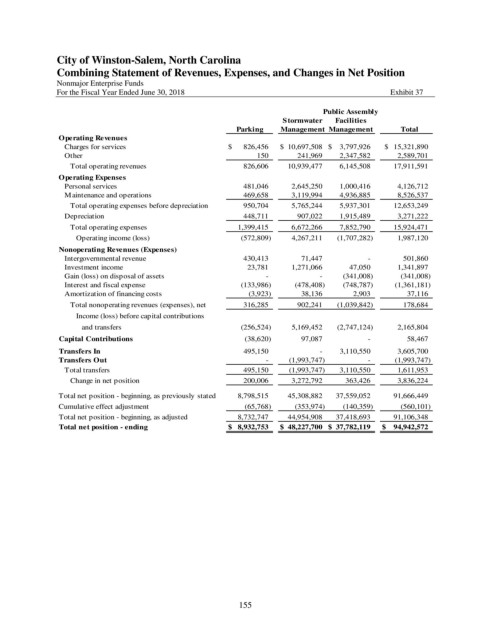
City of Winston-Salem, North Carolina
               Combining Statement of Revenues, Expenses, and Changes in Net Position
               Nonmajor Enterprise Funds
               For the Fiscal Year Ended June 30, 2018                                               Exhibit 37

                                                                                   Public Assembly
                                                                         Stormwater    Facilities
                                                             Parking     Management Management         Total
                Operating Revenues
                 Charges for services                      $        826,456  $    10,697,508 $      3,797,926  $    15,321,890
                 Other                                                     150           241,969        2,347,582          2,589,701
                   Total operating revenues                         826,606      10,939,477        6,145,508        17,911,591
                Operating Expenses
                 Personal services                                  481,046        2,645,250        1,000,416          4,126,712
                 Maintenance and operations                         469,658        3,119,994        4,936,885          8,526,537
                   Total operating expenses before depreciation          950,704        5,765,244        5,937,301        12,653,249
                 Depreciation                                       448,711           907,022        1,915,489          3,271,222
                   Total operating expenses                      1,399,415        6,672,266        7,852,790        15,924,471
                    Operating income (loss)                        (572,809)        4,267,211       (1,707,282)          1,987,120
                Nonoperating Revenues (Expenses)
                 Intergovernmental revenue                          430,413             71,447                       -             501,860
                 Investment income                                    23,781        1,271,066             47,050          1,341,897
                 Gain (loss) on disposal of assets                              -                       -          (341,008)            (341,008)
                 Interest and fiscal expense                       (133,986)          (478,408)         (748,787)         (1,361,181)
                 Amortization of financing costs                       (3,923)             38,136               2,903               37,116
                   Total nonoperating revenues (expenses), net          316,285           902,241       (1,039,842)             178,684
                    Income (loss) before capital contributions
                      and transfers                                (256,524)        5,169,452       (2,747,124)          2,165,804
                Capital Contributions                                (38,620)             97,087                       -               58,467
                Transfers In                                        495,150                       -        3,110,550          3,605,700
                Transfers Out                                                   -       (1,993,747)                      -         (1,993,747)
                 Total transfers                                    495,150       (1,993,747)       3,110,550          1,611,953
                   Change in net position                           200,006        3,272,792           363,426          3,836,224
                Total net position - beginning, as previously stated       8,798,515      45,308,882      37,559,052        91,666,449
                Cumulative effect adjustment                         (65,768)          (353,974)         (140,359)            (560,101)
                Total net position - beginning, as adjusted       8,732,747      44,954,908      37,418,693        91,106,348
                Total net position - ending                $     8,932,753  $    48,227,700 $    37,782,119  $      94,942,572


                                                              155