
Page 193 - 2018 Comprehensive Annual Financial Report - City of Winston-Salem
P. 193
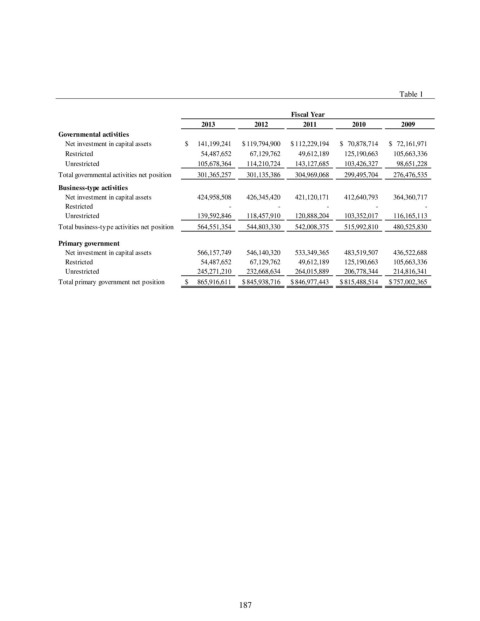
Table 1

                                                                           Fiscal Year
                                                    2013          2012        2011         2010        2009
                Governmental activities
                  Net investment in capital assets  $       141,199,241  $  119,794,900  $  112,229,194  $    70,878,714  $    72,161,971
                  Restricted                               54,487,652        67,129,762        49,612,189      125,190,663      105,663,336
                  Unrestricted                           105,678,364      114,210,724      143,127,685      103,426,327        98,651,228
                Total governmental activities net position           301,365,257      301,135,386      304,969,068      299,495,704      276,476,535
                Business-type activities
                  Net investment in capital assets           424,958,508      426,345,420      421,120,171      412,640,793      364,360,717
                  Restricted                               -            -                         -  -       -
                  Unrestricted                           139,592,846      118,457,910      120,888,204      103,352,017      116,165,113
                Total business-type activities net position           564,551,354      544,803,330      542,008,375      515,992,810      480,525,830

                Primary government
                  Net investment in capital assets           566,157,749      546,140,320      533,349,365      483,519,507      436,522,688
                  Restricted                               54,487,652        67,129,762        49,612,189      125,190,663      105,663,336
                  Unrestricted                           245,271,210      232,668,634      264,015,889      206,778,344      214,816,341
                Total primary government net position  $       865,916,611  $  845,938,716  $  846,977,443  $  815,488,514  $  757,002,365


                                                              187